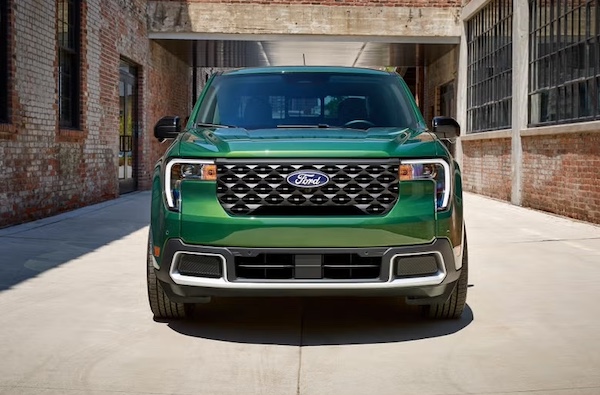
 The Maverick (+14.4%) can’t prevent Ford falling in August.
Note: This update only features the brands still reporting monthly data.
New light vehicle sales in the US skid -5.6% year-on-year in August to 1.4 million units according to GlobalData. However August 2025 volumes were propped up ahead of the expiration of federal tax credits for EVs. Also, deliveries over the Labor Day holiday, traditionally one of the strongest sales periods of the year, will be included in September results this year versus August in 2025. Retail sales are estimate dot fall -7.7% to 1.2 million whereas fleets are up 7.5% to 219,000. The SAAR is up to 16.8 million according to Motor Intelligence, the highest since April 2025 and the sixth straight month above 16 million. Through August, the market is down -3% with retail deliveries down -4.7% and fleet shipments up 4.5%. GlobalData has raised its Calendar Year 2026 forecast by 130,000 units to 16.2 million.
EVs are expected to account for 7.2% of August light vehicle sales vs. a record of 12% a year ago. Hybrids continue to progress, to 18.2% share this month vs. 13.4% in August 2025. The average transaction price of a new vehicle in August is up 2% year-on-year to $45,563, the highest for the month of August according to JD Power and GlobalData. The average incentive per new car and light truck is up 5.9% to $3,384 in August, that’s 6.6% of the sticker price and up from 5.6% in August 2025. Incentives on ICE and hybrid vehicles are up 26% to $3,140 whereas EV incentives drop -20% to $2,297.
Most major OEMs still reporting monthly are down: Ford Motor sinks -10.3%, Toyota Motor is off -4.4% and Hyundai-Kia edges down -0.6% but American Honda is up 1%. Brand-wise, Toyota (-4.8%) remains the favourite just as Ford (-10.2%) endures an 8th consecutive month of year-on-year declines. Honda (+0.4%) snaps its 5th straight monthly gain while Hyundai (-1.7%) is down despite hybrid sales up 99%. Kia (+0.9%) is stable and Subaru (+1.3%) records a 4th straight monthly increase. Acura (+6.5%) also impresses.
As for models with available August volumes, the Ford F-Series (-1.2%) dominates and limit its YoY fall. The Honda CR-V (+10.2%) remains above the Toyota RAV4 (-19.1%), widening the gap between the two nameplates to 82,584 units after 8 months. The Toyota Camry (-9.7%) and Tacoma (-8.9%) are also in a rut. The Honda Civic (+1.8%) and Toyota Corolla (+1.5%) manage to nudge up while the Hyundai Tucson (+18.1%) excels. Further down, the Honda Accord (+19.1%), Subaru Forester (+17.8%), Hyundai Elantra (+16.1%) and Ford Maverick (+14.4%) all post satisfying gains.
Previous month: USA July 2026: Sales down -1.4%, Honda (+12.3%), Acura (+18.9%) stand out
One year ago: USA August 2025: EVs at record 12% share, Kia at all-time high
Full August 2026 data for selected OEMs, brands and models below.
USA August 2026 – OEMs reporting monthly:
| OEM | Aug-26 | /25 | 1-8 2026 | /25 |
| Toyota Motor | 215,556 | – 4.4% | 1,675,307 | – 0.3% |
| Hyundai-Kia | 178,405 | – 0.6% | 1,264,072 | + 2.8% |
| Ford Motor Co | 169,898 | – 10.3% | 1,339,780 | – 9.8% |
| American Honda | 133,996 | + 1.0% | 1,027,465 | + 3.5% |
| Subaru | 62,028 | + 1.3% | 423,822 | – 3.0% |
| Mazda | 34,735 | – 8.9% | 275,749 | – 6.0% |
USA August 2026 – brands reporting monthly:
| Brand | Aug-26 | /25 | 1-8 2026 | /25 |
| Toyota | 182,738 | – 4.8% | 1,442,376 | + 0.4% |
| Ford | 162,392 | – 10.2% | 1,277,175 | – 9.7% |
| Honda | 122,174 | + 0.4% | 933,932 | + 3.4% |
| Hyundai | 86,977 | – 1.7% | 620,025 | + 2.1% |
| Kia | 83,793 | + 0.9% | 590,377 | + 3.5% |
| Subaru | 62,028 | + 1.3% | 423,822 | – 3.0% |
| Mazda | 34,735 | – 8.9% | 275,749 | – 6.0% |
| Lexus | 32,818 | – 1.6% | 232,931 | – 4.5% |
| Acura | 11,822 | + 6.5% | 93,532 | + 4.4% |
| Genesis | 7,635 | – 3.7% | 53,670 | + 3.3% |
| Lincoln | 7,506 | – 10.4% | 62,605 | – 12.3% |
USA August 2026 – models reporting monthly:
| Model | Aug-26 | /25 | 1-8 2026 | /25 |
| Ford F-Series | 67,504 | – 1.2% | 494,060 | – 10.9% |
| Honda CR-V | 37,607 | + 10.2% | 302,056 | + 8.3% |
| Toyota RAV4 | 34,232 | – 19.1% | 219,472 | – 31.7% |
| Toyota Camry | 25,754 | – 9.7% | 235,334 | + 12.1% |
| Toyota Tacoma | 24,403 | – 8.9% | 193,399 | + 5.1% |
| Honda Civic | 21,976 | + 1.8% | 177,411 | + 5.1% |
| Toyota Corolla | 21,772 | + 1.5% | 175,776 | + 8.8% |
| Hyundai Tucson | 21,197 | + 18.1% | 158,523 | + 7.3% |
| Ford Explorer | 19,801 | – 4.0% | 165,630 | + 14.7% |
| Subaru Crosstrek | 19,541 | – 4.4% | 122,953 | – 4.2% |
| Kia Sportage | 18,723 | + 3.9% | 129,713 | + 8.5% |
| Honda Accord | 18,691 | + 19.1% | 129,014 | + 33.3% |
| Hyundai Elantra | 17,747 | + 16.1% | 114,701 | + 12.0% |
| Subaru Forester | 16,760 | + 17.8% | 140,487 | + 15.1% |
| Subaru Outback | 15,233 | – 3.4% | 92,108 | – 11.4% |
| Honda HR-V | 14,251 | + 4.3% | 96,164 | – 8.0% |
| Ford Maverick | 13,680 | + 14.4% | 110,913 | + 0.8% |
| Hyundai Santa Fe | 13,512 | + 5.2% | 90,888 | – 1.3% |
| Ford Transit | 13,401 | – 14.4% | 105,269 | + 0.1% |
| Toyota 4Runner | 13,314 | – 0.8% | 98,991 | + 70.2% |
| Kia K4 | 12,881 | + 6.5% | 98,554 | – 0.3% |
| Hyundai Palisade | 12,729 | – 18.2% | 88,355 | + 2.7% |
| Kia Telluride | 12,693 | + 4.2% | 98,111 | + 16.7% |
| Ford Bronco | 12,204 | – 8.8% | 102,215 | + 3.0% |
| Toyota Tundra | 12,189 | – 0.3% | 98,515 | – 2.2% |
| Ford Bronco Sport | 11,827 | + 8.3% | 95,409 | + 1.2% |
| Lexus RX | 10,256 | + 4.0% | 80,454 | + 12.1% |
| Toyota Sienna | 10,133 | + 29.1% | 74,992 | + 10.2% |
| Toyota Grand Highlander | 9,991 | – 23.5% | 96,917 | + 8.5% |
| Honda Pilot | 9,978 | – 7.5% | 83,486 | – 2.8% |
| Kia Sorento | 9,880 | + 14.5% | 68,266 | + 1.1% |
| Mazda CX-50 | 9,694 | – 3.3% | 86,204 | + 21.8% |
| Mazda CX-5 | 9,657 | – 17.9% | 84,417 | – 13.5% |
| Kia Seltos | 9,214 | + 65.3% | 50,525 | + 42.6% |
| Toyota Corolla Cross | 8,740 | + 25.0% | 80,355 | + 20.0% |
| Ford Expedition | 7,765 | – 11.0% | 53,973 | – 11.6% |
| Kia K5 | 7,523 | + 9.9% | 52,611 | + 11.2% |
| Kia Carnival | 7,389 | + 13.3% | 54,736 | + 20.0% |
| Honda Odyssey | 6,945 | + 3.8% | 56,974 | – 13.1% |
| Hyundai Sonata | 6,899 | + 43.9% | 49,174 | + 16.5% |
| Lexus NX | 6,657 | – 4.4% | 43,879 | – 15.7% |
| Hyundai Kona | 6,165 | – 13.0% | 48,374 | – 9.1% |
| Ford Ranger | 6,033 | + 18.9% | 45,925 | + 4.3% |
| Honda Passport | 6,000 | + 16.0% | 42,001 | + 13.5% |
| Subaru Ascent | 5,155 | + 37.2% | 28,925 | + 2.4% |
| Acura MDX | 5,016 | + 66.3% | 33,903 | + 21.3% |
| Lexus TX | 5,015 | – 4.1% | 38,208 | + 8.8% |
| Honda Ridgeline | 4,549 | – 0.1% | 32,611 | – 3.6% |
| Mazda CX-30 | 4,538 | – 4.7% | 30,680 | – 30.1% |
| Mazda3 | 4,427 | + 91.7% | 28,782 | + 34.9% |
| Mazda CX-90 | 4,265 | – 37.3% | 30,367 | – 27.0% |
| Toyota Land Cruiser | 4,052 | + 34.8% | 23,582 | – 28.5% |
| Hyundai Ioniq 5 | 3,818 | – 50.9% | 28,184 | – 13.8% |
| Toyota BZ/bZ4X | 3,696 | + 262.4% | 24,477 | + 100.6% |
| Ford Mustang | 3,647 | + 12.7% | 35,778 | + 15.4% |
| Lincoln Nautilus | 3,627 | + 28.9% | 23,677 | – 1.7% |
| Toyota Highlander | 3,564 | – 12.3% | 39,217 | + 1.6% |
| Toyota Prius | 3,397 | – 32.1% | 26,054 | – 39.4% |
| Genesis GV70 | 3,229 | – 6.6% | 23,813 | + 5.9% |
| Ford E-Series | 3,095 | – 12.3% | 24,337 | – 8.4% |
| Acura ADX | 3,015 | + 17.4% | 22,510 | + 136.4% |
| Lexus IS | 3,000 | + 61.1% | 20,030 | + 51.3% |
| Lexus ES | 2,983 | – 23.5% | 7,256 | – 72.7% |
| Kia Niro | 2,983 | – 4.5% | 18,472 | + 4.6% |
| Genesis GV80 | 2,711 | + 3.1% | 18,247 | + 6.7% |
| Lexus GX | 2,705 | – 18.8% | 20,505 | – 20.0% |
| Hyundai Venue | 2,639 | – 7.8% | 21,143 | + 1.2% |
| Toyota Crown Signia | 2,493 | + 56.8% | 15,927 | + 4.6% |
| Toyota Sequoia | 2,471 | + 26.7% | 18,972 | + 15.3% |
| Acura Integra | 2,102 | + 20.5% | 18,559 | + 42.0% |
| Ford Mustang Mach-E | 1,989 | – 72.5% | 15,484 | – 54.9% |
| Lincoln Navigator | 1,881 | + 15.8% | 13,930 | – 5.5% |
| Kia EV9 | 1,789 | – 33.2% | 10,474 | + 12.0% |
| Honda Prologue | 1,788 | – 80.9% | 11,749 | – 63.3% |
| Subaru WRX | 1,778 | + 191.0% | 10,324 | + 37.7% |
| Lincoln Aviator | 1,732 | + 22.4% | 16,584 | + 11.3% |
| Acura RDX | 1,683 | – 24.6% | 17,350 | – 21.4% |
| Hyundai Santa Cruz | 1,654 | – 28.5% | 13,191 | – 30.0% |
| Subaru Impreza | 1,556 | – 41.1% | 11,396 | – 43.0% |
| Ford Escape | 1,446 | – 88.2% | 28,182 | – 73.4% |
| Toyota C-HR | 1,384 | + 138300.0% | 6,321 | + 632000.0% |
| Subaru Trailseeker | 1,248 | new | 4,761 | new |
| Mazda CX-70 | 1,229 | – 25.0% | 8,390 | – 27.7% |
| Genesis G70 | 1,076 | – 7.8% | 7,729 | + 4.1% |
| Lexus RZ | 947 | + 20.8% | 9,636 | + 79.7% |
| Mazda MX-5 Miata | 925 | + 10.1% | 6,909 | + 2.0% |
| Kia EV6 | 712 | – 60.4% | 5,429 | – 39.4% |
| Lexus LX | 624 | + 1.6% | 5,038 | + 3.3% |
| Hyundai Ioniq 9 | 589 | – 42.0% | 6,147 | + 98.2% |
| Toyota Crown | 545 | – 61.2% | 6,277 | – 16.9% |
| Toyota GR86 | 512 | – 48.1% | 5,182 | – 30.5% |
| Lexus UX | 473 | – 31.9% | 6,519 | + 0.7% |
| Honda Prelude | 389 | new | 2,466 | new |
| Genesis G80 | 376 | + 16.4% | 2,287 | – 7.1% |
| Subaru Uncharted | 320 | new | 3,170 | new |
| Lincoln Corsair | 266 | – 89.5% | 8,414 | – 52.4% |
| Subaru BRZ | 235 | + 6.8% | 2,020 | – 4.1% |
| Subaru Solterra | 197 | – 86.6% | 5,472 | – 42.6% |
| Lexus LC | 156 | + 81.4% | 1,020 | + 6.9% |
| Genesis G90 | 129 | – 24.6% | 882 | – 14.4% |
| Genesis GV60 | 114 | – 34.9% | 712 | – 51.4% |
| Toyota Supra | 58 | – 81.4% | 2,416 | + 35.1% |
| Toyota Mirai | 36 | + 5.9% | 188 | + 67.9% |
| Hyundai Ioniq 6 | 28 | – 97.3% | 1,345 | – 83.8% |
| Acura TLX | 6 | – 99.4% | 1,102 | – 79.7% |
| Kia EV3 | 6 | new | 6 | new |
| Subaru Legacy | 5 | – 99.8% | 2,206 | – 85.5% |
| Lexus LS | 2 | – 97.1% | 148 | – 82.6% |
| Toyota Venza | 2 | – 33.3% | 10 | – 98.6% |
Source: Manufacturers