

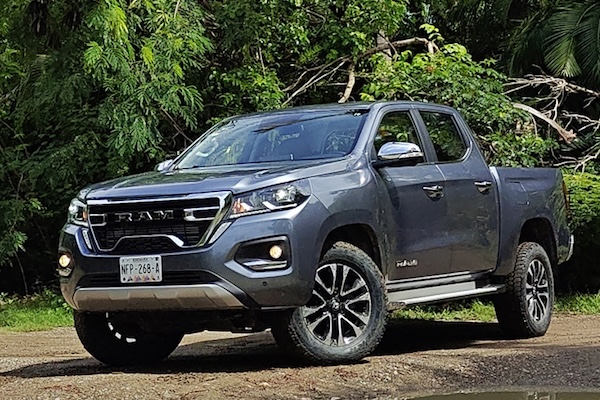
 The Ram 1200 sees its sales grow 221.9% year-on-year.
The Mexican new light vehicle market is up 2.2% year-on-year on revised August 2025 figures (including Geely and Soueast) to 129,362 units. This is the second highest August volume in Mexican history and the best of 10 years, below the record 134,054 units of August 2016. The year-to-date volume is up 5.9% to a record 1,014,718 units, the first time above 1 million in 8 months and eclipsing the previous best of 990,567 units in 2017. Note not all brands communicate sales in this country, notably BYD which is estimated to be in the Top 10.
Nissan (-5.4%) disappoints but easily stays on top of the brands charts at 17.3% share vs. 12.4% for the #2 Chevrolet (+1.2%). Volkswagen (+7.4%), Toyota (+11.4%) and Mazda (+16.8%) all beat the market with solid YoY gains and round out the Top 5. Geely (+106.7%) is the biggest gainer in the Top 10 and breaks its volume record at 4,282. Ram (+28.8%) also impresses but falls two spots on July to #9. Below, Renault (+24.8%) stands out but is the only additional gainer in the Top 17. Jetour (+92.5%) almost doubles its sales year-on-year to #28.
Over in the models ranking, the Nissan Versa (-4%) continues to dominate with 5.5% share, while the Chevrolet Aveo (-4.9%) is back to the 2nd spot it also holds year-to-date. Both the Nissan NP300 (+18.7%) and Kia K3 (-2.6%) drop one rank on last month to follow. The Ram 1200 (+221.9%) repeats at a record 5th place, distancing the Mazda CX-30 (+9.6%), VW Virtus (+53.4%) and Toyota Hilux (+100%), the latter doubling its sales YoY as the new generation hits dealerships. The Mazda CX-5 (+110.6%), Chevrolet Captiva (+82.9%) and Groove (+80%) impress below.
Previous month: Mexico July 2026: Ram 1200 up to new heights in strongest market in 10 years
One year ago: Mexico August 2025: Nissan places 5 models in Top 8, Magnite continues to improve
Full August 2026 Top 50 All brands and Top 377 All models below.
Mexico August 2026 – brands:
| Pos | Brand | Aug-26 | % | /25 | Jul | 2026 | % | /25 | Pos | FY25 |
| 1 | Nissan | 22,388 | 17.3% | – 5.4% | 1 | 172,941 | 17.0% | – 1.5% | 1 | 1 |
| 2 | Chevrolet | 15,993 | 12.4% | + 1.2% | 2 | 122,058 | 12.0% | + 3.2% | 2 | 2 |
| 3 | Volkswagen | 11,789 | 9.1% | + 7.4% | 3 | 89,041 | 8.8% | + 2.9% | 3 | 3 |
| 4 | Toyota | 10,870 | 8.4% | + 11.4% | 4 | 84,073 | 8.3% | + 4.5% | 4 | 4 |
| 5 | Mazda | 9,258 | 7.2% | + 16.8% | 6 | 70,115 | 6.9% | + 3.7% | 6 | 6 |
| 6 | Kia | 9,114 | 7.0% | – 5.1% | 5 | 73,273 | 7.2% | + 2.0% | 5 | 5 |
| 7 | Hyundai | 4,873 | 3.8% | + 11.8% | 8 | 36,107 | 3.6% | + 5.2% | 7 | 7 |
| 8 | Ford | 4,758 | 3.7% | + 1.0% | 9 | 34,319 | 3.4% | – 1.5% | 10 | 8 |
| 9 | Ram | 4,468 | 3.5% | + 28.8% | 7 | 34,756 | 3.4% | + 45.5% | 9 | 12 |
| 10 | Geely | 4,282 | 3.3% | + 106.7% | 10 | 31,606 | 3.1% | + 203.5% | 11 | 16 |
| 11 | MG | 3,983 | 3.1% | – 6.0% | 11 | 35,842 | 3.5% | + 12.8% | 8 | 9 |
| 12 | Renault | 3,094 | 2.4% | + 24.8% | 12 | 23,789 | 2.3% | + 16.5% | 13 | 13 |
| 13 | Honda | 2,861 | 2.2% | – 9.1% | 13 | 25,792 | 2.5% | + 3.6% | 12 | 10 |
| 14 | Suzuki | 2,235 | 1.7% | – 19.7% | 14 | 21,098 | 2.1% | – 18.3% | 14 | 11 |
| 15 | Mitsubishi | 2,114 | 1.6% | – 2.7% | 15 | 19,406 | 1.9% | + 5.2% | 15 | 14 |
| 16 | JAC | 1,901 | 1.5% | – 6.1% | 16 | 15,371 | 1.5% | – 5.2% | 16 | 15 |
| 17 | Changan | 1,429 | 1.1% | – 28.8% | 17 | 13,806 | 1.4% | + 24.3% | 17 | 17 |
| 18 | Peugeot | 1,422 | 1.1% | + 9.5% | 21 | 11,780 | 1.2% | + 0.7% | 18 | 18 |
| 19 | Seat | 1,397 | 1.1% | + 4.3% | 18 | 10,253 | 1.0% | – 7.7% | 19 | 19 |
| 20 | BMW | 1,228 | 0.9% | – 2.1% | 19 | 9,393 | 0.9% | – 3.8% | 20 | 22 |
| 21 | GWM | 1,189 | 0.9% | – 5.7% | 22 | 8,830 | 0.9% | – 8.8% | 21 | 21 |
| 22 | Dodge | 1,077 | 0.8% | – 21.7% | 20 | 8,143 | 0.8% | + 19.7% | 23 | 23 |
| 23 | Jeep | 1,006 | 0.8% | – 26.0% | 23 | 8,764 | 0.9% | – 11.5% | 22 | 20 |
| 24 | Audi | 740 | 0.6% | – 1.6% | 24 | 5,973 | 0.6% | + 3.2% | 24 | 26 |
| 25 | Mercedes | 717 | 0.6% | – 2.8% | 26 | 5,930 | 0.6% | – 16.6% | 25 | 24 |
| 26 | GMC | 683 | 0.5% | – 12.2% | 25 | 5,370 | 0.5% | – 3.0% | 26 | 25 |
| 27 | Cupra | 510 | 0.4% | – 23.4% | 27 | 4,400 | 0.4% | + 57.5% | 27 | 29 |
| 28 | Jetour | 439 | 0.3% | + 92.5% | 28 | 3,564 | 0.4% | + 328.9% | 28 | 38 |
| 29 | Subaru | 386 | 0.3% | – 4.9% | 30 | 3,098 | 0.3% | + 15.3% | 29 | 30 |
| 30 | Volvo | 309 | 0.2% | – 43.6% | 35 | 2,334 | 0.2% | – 44.1% | 30 | 27 |
| 31 | Buick | 276 | 0.2% | – 11.3% | 36 | 1,723 | 0.2% | – 31.5% | 35 | 32 |
| 32 | Lexus | 270 | 0.2% | + 34.3% | 32 | 1,900 | 0.2% | + 8.3% | 34 | 35 |
| 33 | Mini | 257 | 0.2% | – 23.3% | 33 | 2,170 | 0.2% | – 16.8% | 32 | 31 |
| 34 | Porsche | 226 | 0.2% | – 21.3% | 31 | 2,200 | 0.2% | – 1.1% | 31 | 34 |
| 35 | Lynk & Co | 209 | 0.2% | new | 37 | 1,327 | 0.1% | new | 37 | – |
| 36 | Fiat | 199 | 0.2% | – 58.5% | 34 | 2,157 | 0.2% | – 38.2% | 33 | 28 |
| 37 | Foton | 194 | 0.1% | – 22.4% | 39 | 1,233 | 0.1% | – 26.8% | 40 | 37 |
| 38 | Leapmotor | 177 | 0.1% | new | 29 | 1,116 | 0.1% | new | 42 | – |
| 39 | Lincoln | 153 | 0.1% | – 26.1% | 38 | 1,228 | 0.1% | – 11.1% | 41 | 39 |
| 40 | Isuzu | 145 | 0.1% | – 22.9% | 40 | 1,537 | 0.2% | – 8.2% | 36 | 36 |
| 41 | Deepal | 134 | 0.1% | + 52.3% | 44 | 719 | 0.1% | + 138.1% | 45 | 47 |
| 42 | Land Rover | 130 | 0.1% | – 15.6% | 41 | 1,262 | 0.1% | – 8.4% | 38 | 40 |
| 43 | Zeekr | 97 | 0.1% | new | 42 | 1,250 | 0.1% | new | 39 | – |
| 44 | Soueast | 91 | 0.1% | + 40.0% | 46 | 552 | 0.1% | + 286.0% | 46 | 48 |
| 45 | Alfa Romeo | 79 | 0.1% | + 192.6% | 47 | 355 | 0.0% | + 107.6% | 48 | 50 |
| 46 | Cadillac | 76 | 0.1% | – 30.3% | 43 | 961 | 0.1% | – 23.3% | 43 | 41 |
| 47 | Infiniti | 76 | 0.1% | – 43.3% | 45 | 817 | 0.1% | + 7.2% | 44 | 43 |
| 48 | Acura | 36 | 0.0% | – 36.8% | 48 | 448 | 0.0% | – 9.3% | 47 | 46 |
| 49 | IM | 23 | 0.0% | – 36.1% | 49 | 177 | 0.0% | + 78.8% | 49 | 51 |
| 50 | Bentley | 1 | 0.0% | – 66.7% | – | 8 | 0.0% | – 11.1% | 55 | 55 |
Mexico August 2026 – models:
| Pos | Model | Aug-26 | % | /25 | Jul | 2026 | % | /25 | Pos | FY25 |
| 1 | Nissan Versa | 7,166 | 5.5% | – 4.0% | 1 | 51,636 | 5.1% | – 12.1% | 1 | 1 |
| 2 | Chevrolet Aveo | 5,276 | 4.1% | – 4.9% | 4 | 45,844 | 4.5% | + 16.2% | 2 | 2 |
| 3 | Nissan Pickup (NP300) | 5,246 | 4.1% | + 18.7% | 2 | 34,107 | 3.4% | – 8.3% | 4 | 3 |
| 4 | Kia K3 | 4,931 | 3.8% | – 2.6% | 3 | 39,375 | 3.9% | + 6.5% | 3 | 4 |
| 5 | Ram 1200 | 2,974 | 2.3% | + 221.9% | 5 | 19,520 | 1.9% | + 141.7% | 6 | 37 |
| 6 | Mazda CX-30 | 2,793 | 2.2% | + 9.6% | 6 | 19,134 | 1.9% | + 3.8% | 7 | 6 |
| 7 | VW Virtus | 2,612 | 2.0% | + 53.4% | 7 | 16,147 | 1.6% | + 15.7% | 12 | 9 |
| 8 | Toyota Hilux | 2,530 | 2.0% | + 100.0% | 29 | 13,700 | 1.4% | + 10.2% | 16 | 18 |
| 9 | Hyundai Grand i10 | 2,208 | 1.7% | + 2.7% | 15 | 17,461 | 1.7% | + 11.5% | 9 | 10 |
| 10 | Mazda2 | 2,144 | 1.7% | + 19.0% | 9 | 16,591 | 1.6% | + 1.0% | 10 | 7 |
| 11 | Chevrolet Captiva | 2,070 | 1.6% | + 82.9% | 11 | 12,210 | 1.2% | + 11.8% | 23 | 25 |
| 12 | Chevrolet Groove | 2,027 | 1.6% | + 80.0% | 12 | 13,428 | 1.3% | + 38.0% | 17 | 23 |
| 13 | Nissan March | 1,959 | 1.5% | – 28.0% | 20 | 16,394 | 1.6% | – 19.9% | 11 | 5 |
| 14 | Ford Territory | 1,943 | 1.5% | + 64.0% | 16 | 12,156 | 1.2% | + 46.3% | 25 | 32 |
| 15 | Nissan Magnite | 1,839 | 1.4% | – 20.5% | 19 | 19,606 | 1.9% | + 99.2% | 5 | 20 |
| 16 | Mazda CX-5 | 1,826 | 1.4% | + 110.6% | 39 | 12,346 | 1.2% | + 55.3% | 22 | 31 |
| 17 | MG 5 | 1,809 | 1.4% | + 10.1% | 10 | 18,456 | 1.8% | + 27.1% | 8 | 14 |
| 18 | Renault Kwid | 1,786 | 1.4% | + 27.9% | 8 | 15,095 | 1.5% | + 45.9% | 14 | 22 |
| 19 | Chevrolet S10 | 1,669 | 1.3% | – 25.1% | 23 | 15,052 | 1.5% | + 17.0% | 15 | 15 |
| 20 | Hyundai Creta | 1,667 | 1.3% | + 11.7% | 14 | 12,177 | 1.2% | + 2.1% | 24 | 12 |
| 21 | Chevrolet Tornado Van | 1,641 | 1.3% | + 8.0% | 28 | 9,938 | 1.0% | – 20.3% | 32 | 21 |
| 22 | Nissan X-Trail | 1,636 | 1.3% | + 49.1% | 13 | 12,537 | 1.2% | + 22.4% | 20 | 26 |
| 23 | Toyota RAV4 | 1,610 | 1.2% | + 25.1% | 21 | 9,433 | 0.9% | – 23.0% | 35 | 28 |
| 24 | VW Jetta | 1,590 | 1.2% | – 1.3% | 22 | 11,857 | 1.2% | – 15.4% | 28 | 16 |
| 25 | VW Taos | 1,565 | 1.2% | – 18.7% | 24 | 12,673 | 1.2% | – 4.1% | 19 | 13 |
| 26 | Geely Emgrand | 1,546 | 1.2% | + 13.4% | 18 | 13,120 | 1.3% | + 144.3% | 18 | 39 |
| 27 | VW Tiguan | 1,534 | 1.2% | + 22.7% | 25 | 12,362 | 1.2% | + 0.1% | 21 | 19 |
| 28 | Nissan Urvan | 1,391 | 1.1% | + 52.9% | 27 | 8,018 | 0.8% | + 37.4% | 40 | 50 |
| 29 | Kia Seltos | 1,372 | 1.1% | + 7.9% | 33 | 9,887 | 1.0% | + 1.9% | 33 | 27 |
| 30 | Mazda3 | 1,263 | 1.0% | – 7.7% | 49 | 12,004 | 1.2% | – 15.7% | 26 | 17 |
| 31 | Nissan Kicks | 1,238 | 1.0% | – 53.7% | 17 | 15,669 | 1.5% | – 12.0% | 13 | 8 |
| 32 | Toyota Yaris | 1,225 | 0.9% | + 25.3% | 26 | 10,447 | 1.0% | + 48.4% | 30 | 35 |
| 33 | Nissan Sentra | 1,220 | 0.9% | – 30.5% | 35 | 11,857 | 1.2% | – 14.5% | 27 | 11 |
| 34 | Ford F-Series/Lobo | 1,219 | 0.9% | – 9.5% | 52 | 8,024 | 0.8% | – 13.3% | 39 | 33 |
| 35 | VW Tera | 1,183 | 0.9% | + 803.1% | 30 | 10,032 | 1.0% | + 7558.0% | 31 | 91 |
| 36 | Chevrolet Onix | 1,175 | 0.9% | + 96.2% | 61 | 7,436 | 0.7% | – 12.4% | 44 | 41 |
| 37 | VW Saveiro | 1,152 | 0.9% | – 10.3% | 36 | 9,508 | 0.9% | – 13.9% | 34 | 29 |
| 38 | Ram 700 | 1,109 | 0.9% | – 44.2% | 34 | 11,269 | 1.1% | + 4.1% | 29 | 24 |
| 39 | Dodge Nuevo Attitude | 1,029 | 0.8% | + 61.0% | 32 | 7,556 | 0.7% | + 94.6% | 43 | 58 |
| 40 | Seat Ibiza | 987 | 0.8% | + 20.7% | 44 | 6,313 | 0.6% | – 4.1% | 51 | 47 |
| 41 | Toyota Tacoma | 970 | 0.7% | + 17.0% | 42 | 7,140 | 0.7% | + 5.1% | 45 | 43 |
| 42 | MG ZS | 941 | 0.7% | + 1522.4% | 37 | 6,484 | 0.6% | + 267.8% | 49 | 119 |
| 43 | Kia K4 | 920 | 0.7% | – 18.9% | 40 | 8,347 | 0.8% | – 13.4% | 37 | 30 |
| 44 | Geely EX5 | 918 | 0.7% | + 2450.0% | 48 | 6,597 | 0.7% | + 18225.0% | 47 | 133 |
| 45 | Geely EX2 | 889 | 0.7% | n/a | 46 | 5,137 | 0.5% | + 6402.5% | 58 | n/a |
| 46 | Mitsubishi L200 | 859 | 0.7% | – 6.6% | 38 | 8,203 | 0.8% | – 8.0% | 38 | 38 |
| 47 | Suzuki Swift | 840 | 0.6% | – 15.9% | 47 | 8,618 | 0.8% | + 4.2% | 36 | 36 |
| 48 | Toyota Corolla | 837 | 0.6% | + 33.9% | 45 | 6,794 | 0.7% | + 1.8% | 46 | 46 |
| 49 | Kia Sonet | 821 | 0.6% | – 35.8% | 53 | 7,591 | 0.7% | – 10.9% | 42 | 34 |
| 50 | VW Taigun | 780 | 0.6% | – 21.8% | 43 | 6,246 | 0.6% | – 13.8% | 53 | 44 |
| 51 | Honda City | 770 | 0.6% | + 62.4% | 50 | 6,535 | 0.6% | + 95.3% | 48 | 68 |
| 52 | Kia Sportage | 755 | 0.6% | + 25.2% | 41 | 6,290 | 0.6% | + 34.4% | 52 | 57 |
| 53 | MG 3 | 702 | 0.5% | – 0.1% | 78 | 5,134 | 0.5% | – 8.9% | 59 | 48 |
| 54 | GWM Haval Jolion | 697 | 0.5% | + 16.8% | 51 | 5,270 | 0.5% | + 21.0% | 56 | 59 |
| 55 | Hyundai Tucson | 666 | 0.5% | + 55.2% | 58 | 3,220 | 0.3% | – 7.0% | 72 | 72 |
| 56 | JAC Frison | 666 | 0.5% | – 31.9% | 57 | 5,937 | 0.6% | – 6.8% | 54 | 49 |
| 57 | Geely Coolray | 632 | 0.5% | + 115.7% | 69 | 4,086 | 0.4% | + 119.6% | 64 | 94 |
| 58 | Honda CR-V | 629 | 0.5% | + 4.5% | 54 | 6,458 | 0.6% | + 1.0% | 50 | 42 |
| 59 | Toyota Corolla Cross | 593 | 0.5% | + 22.0% | 60 | 4,900 | 0.5% | + 10.5% | 61 | 60 |
| 60 | Nissan Kait | 584 | 0.5% | new | 66 | 2,127 | 0.2% | new | 93 | – |
| 61 | Honda HR-V | 582 | 0.4% | – 11.3% | 56 | 5,204 | 0.5% | – 7.6% | 57 | 45 |
| 62 | Mazda CX-3 | 552 | 0.4% | – 26.1% | 63 | 4,530 | 0.4% | – 8.3% | 62 | 55 |
| 63 | Chevrolet Trax | 546 | 0.4% | + 23.5% | 65 | 3,988 | 0.4% | + 7.8% | 66 | 63 |
| 64 | Honda BR-V | 523 | 0.4% | – 17.6% | 62 | 3,908 | 0.4% | – 7.0% | 67 | 66 |
| 65 | Toyota Raize | 515 | 0.4% | – 46.5% | 64 | 4,923 | 0.5% | – 2.0% | 60 | 52 |
| 66 | Mitsubishi Outlander Sport | 509 | 0.4% | – 22.6% | 72 | 4,526 | 0.4% | + 0.6% | 63 | 56 |
| 67 | JAC 4 | 475 | 0.4% | + 159.6% | 83 | 1,910 | 0.2% | + 2.9% | 96 | 110 |
| 68 | Suzuki Jimny | 465 | 0.4% | – 25.4% | 67 | 4,029 | 0.4% | – 22.6% | 65 | 53 |
| 69 | Toyota Avanza | 455 | 0.4% | – 53.0% | 31 | 7,922 | 0.8% | + 1.6% | 41 | 40 |
| 70 | Peugeot Partner Rapid | 449 | 0.3% | + 116.9% | 106 | 2,855 | 0.3% | + 25.9% | 76 | 92 |
| 71 | Toyota Sienna | 434 | 0.3% | + 29.9% | 68 | 5,496 | 0.5% | + 13.4% | 55 | 54 |
| 72 | Toyota 4Runner | 433 | 0.3% | + 112.3% | 81 | 1,642 | 0.2% | + 88.5% | 106 | 165 |
| 73 | MG HS/eHS | 416 | 0.3% | + 208.1% | 70 | 2,696 | 0.3% | + 59.3% | 79 | 140 |
| 74 | Toyota Prius | 408 | 0.3% | – 23.2% | 75 | 3,271 | 0.3% | – 6.3% | 71 | 71 |
| 75 | Ram 1500-4000 | 384 | 0.3% | – 22.6% | 55 | 3,470 | 0.3% | + 17.4% | 70 | 76 |
| 76 | Mitsubishi Outlander | 373 | 0.3% | + 448.5% | 97 | 2,146 | 0.2% | + 246.7% | 90 | 201 |
| 77 | Chevrolet Silverado/Cheyenne | 344 | 0.3% | – 66.6% | 76 | 3,553 | 0.4% | – 43.0% | 69 | 51 |
| 78 | Changan Alsvin | 338 | 0.3% | – 0.9% | 80 | 2,546 | 0.3% | + 7.5% | 81 | 84 |
| 79 | Chevrolet Spark EUV | 328 | 0.3% | + 9.0% | 84 | 2,628 | 0.3% | + 756.0% | 80 | 179 |
| 80 | VW Teramont | 310 | 0.2% | – 21.7% | 77 | 2,984 | 0.3% | – 16.4% | 75 | 70 |
| 81 | Suzuki Fronx | 307 | 0.2% | – 16.6% | 85 | 2,379 | 0.2% | – 16.0% | 84 | 78 |
| 82 | Peugeot Partner | 300 | 0.2% | – 2.3% | 100 | 2,820 | 0.3% | + 2.7% | 78 | 77 |
| 83 | VW Crafter | 298 | 0.2% | – 44.3% | 89 | 1,607 | 0.2% | + 14.5% | 109 | 107 |
| 84 | Mitsubishi Xpander | 291 | 0.2% | – 10.2% | 86 | 3,216 | 0.3% | + 23.2% | 73 | 73 |
| 85 | Suzuki Dzire | 288 | 0.2% | + 388.1% | 95 | 2,326 | 0.2% | + 2669.0% | 86 | 168 |
| 86 | Ford Edge | 281 | 0.2% | + 3412.5% | 74 | 2,141 | 0.2% | + 26662.5% | 92 | 277 |
| 87 | Cupra Formentor | 275 | 0.2% | – 26.1% | 88 | 2,366 | 0.2% | + 27.1% | 85 | 96 |
| 88 | Renault Arkana | 270 | 0.2% | + 59.8% | 105 | 1,683 | 0.2% | + 16.8% | 101 | 120 |
| 89 | Toyota Camry | 265 | 0.2% | – 39.2% | 87 | 2,845 | 0.3% | + 21.1% | 77 | 82 |
| 90 | Ford Ranger | 261 | 0.2% | – 46.2% | 59 | 3,800 | 0.4% | – 13.3% | 68 | 61 |
| 91 | BMW X3 | 259 | 0.2% | – 16.2% | 91 | 2,019 | 0.2% | + 55.7% | 95 | 115 |
| 92 | Seat Leon | 259 | 0.2% | + 5.3% | 96 | 2,475 | 0.2% | + 17.3% | 83 | 89 |
| 93 | Chevrolet Tracker | 253 | 0.2% | – 66.4% | 111 | 1,311 | 0.1% | – 75.6% | 126 | 62 |
| 94 | Toyota Highlander | 252 | 0.2% | – 47.8% | 79 | 3,072 | 0.3% | – 20.0% | 74 | 64 |
| 95 | Ford Transit | 243 | 0.2% | – 53.3% | 73 | 2,165 | 0.2% | – 33.4% | 89 | 74 |
| 96 | GMC Sierra | 241 | 0.2% | – 28.3% | 99 | 1,556 | 0.2% | – 20.5% | 110 | 93 |
| 97 | Mazda CX-90 | 239 | 0.2% | + 47.5% | 126 | 1,539 | 0.2% | – 19.6% | 113 | 101 |
| 98 | Jeep Compass | 238 | 0.2% | – 27.4% | 92 | 2,228 | 0.2% | + 7.3% | 88 | 86 |
| 99 | Renault Oroch | 238 | 0.2% | – 13.1% | 122 | 1,441 | 0.1% | – 13.2% | 120 | 111 |
| 100 | Cupra Terramar | 235 | 0.2% | – 20.1% | 101 | 2,034 | 0.2% | + 118.5% | 94 | 151 |
| 101 | Jeep Cherokee | 232 | 0.2% | new | 148 | 702 | 0.1% | new | 183 | – |
| 102 | Renault Boreal | 231 | 0.2% | new | 125 | 849 | 0.1% | new | 166 | – |
| 103 | Suzuki Ertiga | 231 | 0.2% | – 46.0% | 94 | 2,500 | 0.2% | – 29.8% | 82 | 69 |
| 104 | Ford E-Transit | 230 | 0.2% | + 22900.0% | 290 | 287 | 0.0% | + 322.1% | 241 | 264 |
| 105 | VW Transporter | 225 | 0.2% | + 63.0% | 103 | 1,186 | 0.1% | + 54.8% | 137 | 155 |
| 106 | Changan Eado Plus | 214 | 0.2% | + 2.9% | 93 | 2,302 | 0.2% | + 175.7% | 87 | 152 |
| 107 | Peugeot 2008 | 213 | 0.2% | – 46.9% | 123 | 1,549 | 0.2% | – 33.0% | 112 | 85 |
| 108 | BMW X1 | 202 | 0.2% | + 48.5% | 116 | 1,340 | 0.1% | – 19.8% | 125 | 126 |
| 109 | Peugeot Rifter | 202 | 0.2% | + 21.7% | 98 | 1,858 | 0.2% | – 21.4% | 97 | 83 |
| 110 | GWM Ora 5 | 199 | 0.2% | new | 263 | 286 | 0.0% | new | 242 | – |
| 111 | Audi Q3 | 196 | 0.2% | + 133.3% | 114 | 1,520 | 0.1% | + 3.3% | 116 | 141 |
| 112 | Chevrolet Montana | 192 | 0.1% | – 28.6% | 120 | 1,478 | 0.1% | – 33.2% | 119 | 87 |
| 113 | Audi A3 | 190 | 0.1% | + 15.2% | 113 | 1,267 | 0.1% | + 2.6% | 131 | 143 |
| 114 | Buick Envista | 190 | 0.1% | – 4.0% | 152 | 911 | 0.1% | – 33.7% | 161 | 130 |
| 115 | Changan New Star Truck | 189 | 0.1% | – 10.8% | 118 | 1,677 | 0.2% | + 28.9% | 102 | 127 |
| 116 | JAC Sunray | 184 | 0.1% | + 31.4% | 82 | 1,755 | 0.2% | + 26.8% | 100 | 135 |
| 117 | JAC 8 | 181 | 0.1% | – 18.5% | 102 | 1,806 | 0.2% | + 11.9% | 99 | 104 |
| 118 | Audi Q5 | 180 | 0.1% | + 2.9% | 119 | 1,405 | 0.1% | + 54.6% | 122 | 148 |
| 119 | Mazda CX-50 | 180 | 0.1% | – 16.3% | 90 | 1,670 | 0.2% | – 10.9% | 103 | 106 |
| 120 | Leapmotor B10 | 177 | 0.1% | new | 71 | 1,116 | 0.1% | new | 143 | – |
| 121 | Toyota Hiace | 177 | 0.1% | – 30.6% | 107 | 1,414 | 0.1% | – 17.9% | 121 | 116 |
| 122 | Ford Maverick | 175 | 0.1% | – 27.4% | 115 | 1,638 | 0.2% | – 13.3% | 107 | 103 |
| 123 | Renault Nueva Koleos | 175 | 0.1% | + 48.3% | 124 | 1,221 | 0.1% | + 108.0% | 134 | 172 |
| 124 | Jetour T2 | 173 | 0.1% | + 4.2% | 112 | 1,535 | 0.2% | + 324.0% | 114 | 177 |
| 125 | Mercedes Sprinter | 173 | 0.1% | + 14.6% | 131 | 1,208 | 0.1% | – 18.8% | 135 | 113 |
| 126 | GMC Terrain | 171 | 0.1% | + 7.5% | 108 | 1,486 | 0.1% | + 81.7% | 118 | 144 |
| 127 | Jeep Renegade | 171 | 0.1% | – 40.2% | 162 | 1,650 | 0.2% | – 21.4% | 105 | 95 |
| 128 | Mercedes GLC | 165 | 0.1% | + 39.8% | 144 | 1,142 | 0.1% | – 23.5% | 141 | 131 |
| 129 | VW Polo | 165 | 0.1% | – 63.1% | 141 | 1,236 | 0.1% | – 70.1% | 132 | 67 |
| 130 | Subaru Forester | 160 | 0.1% | – 23.1% | 117 | 1,269 | 0.1% | + 18.7% | 130 | 146 |
| 131 | BMW X5 | 159 | 0.1% | + 48.6% | 142 | 1,071 | 0.1% | + 6.8% | 152 | 160 |
| 132 | BMW 2 Series | 157 | 0.1% | + 18.0% | 146 | 975 | 0.1% | – 1.2% | 158 | 163 |
| 133 | Subaru Crosstrek | 150 | 0.1% | – 4.5% | 132 | 1,164 | 0.1% | – 1.8% | 140 | 145 |
| 134 | Hyundai HB20 | 149 | 0.1% | – 9.7% | 284 | 1,651 | 0.2% | – 26.1% | 104 | 108 |
| 135 | Changan CS35 Plus | 148 | 0.1% | – 50.3% | 129 | 1,816 | 0.2% | – 10.2% | 98 | 99 |
| 136 | Changan CS55 Plus | 147 | 0.1% | – 64.4% | 138 | 2,145 | 0.2% | + 51.6% | 91 | 98 |
| 137 | Fiat Pulse | 147 | 0.1% | – 51.0% | 104 | 1,529 | 0.2% | – 3.7% | 115 | 102 |
| 138 | GWM Poer | 143 | 0.1% | – 61.0% | 121 | 1,550 | 0.2% | – 40.0% | 111 | 80 |
| 139 | Changan Hunter | 140 | 0.1% | – 23.9% | 137 | 1,099 | 0.1% | + 18.0% | 147 | 157 |
| 140 | Mercedes GLE | 140 | 0.1% | + 28.4% | 151 | 1,048 | 0.1% | – 11.1% | 154 | 153 |
| 141 | Deepal S07 | 134 | 0.1% | + 52.3% | 157 | 719 | 0.1% | + 138.1% | 179 | 223 |
| 142 | Mazda MX-5 | 134 | 0.1% | + 6.3% | 194 | 728 | 0.1% | + 1.8% | 178 | 175 |
| 143 | Seat Arona | 134 | 0.1% | – 41.7% | 110 | 1,203 | 0.1% | – 22.5% | 136 | 118 |
| 144 | Geely Cityray | 133 | 0.1% | – 32.8% | 145 | 1,176 | 0.1% | + 14.2% | 138 | 150 |
| 145 | GMC Canyon | 133 | 0.1% | + 15.7% | 130 | 1,077 | 0.1% | + 13.4% | 151 | 159 |
| 146 | Mini Cooper | 133 | 0.1% | – 38.1% | 127 | 1,051 | 0.1% | – 35.3% | 153 | 122 |
| 147 | Honda Pilot | 132 | 0.1% | – 21.0% | 149 | 1,017 | 0.1% | – 9.0% | 156 | 156 |
| 148 | Renault Kardian | 132 | 0.1% | – 14.3% | 164 | 1,379 | 0.1% | – 10.0% | 123 | 129 |
| 149 | Honda Civic | 131 | 0.1% | – 70.2% | 147 | 1,633 | 0.2% | – 39.8% | 108 | 81 |
| 150 | Chevrolet Colorado | 129 | 0.1% | – 33.5% | 150 | 1,093 | 0.1% | – 8.2% | 150 | 136 |
| 151 | Volvo XC40 | 128 | 0.1% | + 124.6% | 171 | 432 | 0.0% | + 3.3% | 213 | 228 |
| 152 | Ford Bronco Sport | 127 | 0.1% | – 20.6% | 167 | 1,103 | 0.1% | – 30.5% | 146 | 123 |
| 153 | Changan Honor S | 126 | 0.1% | – 21.7% | 166 | 1,098 | 0.1% | – 23.5% | 148 | 134 |
| 154 | Kia EV3 | 126 | 0.1% | new | – | 126 | 0.0% | new | 294 | – |
| 155 | Jeep Grand Cherokee | 120 | 0.1% | – 27.3% | 133 | 1,302 | 0.1% | – 5.9% | 127 | 125 |
| 156 | VW Caddy | 120 | 0.1% | + 6.2% | 158 | 875 | 0.1% | + 5.3% | 164 | 164 |
| 157 | GWM Haval H6 | 118 | 0.1% | – 38.9% | 136 | 1,276 | 0.1% | – 30.2% | 128 | 105 |
| 158 | Jetour G700 | 115 | 0.1% | new | 258 | 221 | 0.0% | new | 261 | – |
| 159 | Kia Sorento | 114 | 0.1% | – 6.6% | 128 | 1,033 | 0.1% | – 19.0% | 155 | 154 |
| 160 | Jeep Wrangler | 113 | 0.1% | – 50.9% | 134 | 1,374 | 0.1% | – 23.3% | 124 | 100 |
| 161 | Geely Monjaro | 112 | 0.1% | + 23.1% | 183 | 815 | 0.1% | + 204.1% | 168 | 204 |
| 162 | Lincoln Nautilus | 110 | 0.1% | + 50.7% | 172 | 640 | 0.1% | – 3.9% | 192 | 187 |
| 163 | Renault Duster | 109 | 0.1% | – 46.0% | 185 | 536 | 0.1% | – 52.2% | 204 | 142 |
| 164 | Hyundai Elantra | 108 | 0.1% | + 129.8% | 109 | 711 | 0.1% | + 118.8% | 182 | 238 |
| 165 | Lynk & Co 08 | 108 | 0.1% | new | 156 | 856 | 0.1% | new | 165 | – |
| 166 | Porsche 911 | 102 | 0.1% | + 4.1% | 163 | 966 | 0.1% | + 84.4% | 159 | 206 |
| 167 | Renault Kangoo | 102 | 0.1% | – 10.5% | 135 | 1,124 | 0.1% | – 5.8% | 142 | 147 |
| 168 | Chevrolet Suburban | 99 | 0.1% | – 51.0% | 153 | 1,095 | 0.1% | – 37.1% | 149 | 112 |
| 169 | Suzuki Across | 99 | 0.1% | new | 254 | 127 | 0.0% | new | 292 | – |
| 170 | Isuzu Elf | 97 | 0.1% | – 48.4% | 140 | 1,489 | 0.1% | – 11.1% | 117 | 117 |
| 171 | JAC Sunray City | 97 | 0.1% | + 9600.0% | 186 | 661 | 0.1% | + 1171.2% | 189 | 306 |
| 172 | VW Amarok | 94 | 0.1% | – 40.9% | 178 | 649 | 0.1% | – 43.0% | 190 | 138 |
| 173 | BMW X2 | 93 | 0.1% | – 9.7% | 154 | 771 | 0.1% | + 2.5% | 173 | 181 |
| 174 | Mazda BT-50 | 93 | 0.1% | + 2.2% | 143 | 1,233 | 0.1% | + 65.5% | 133 | 180 |
| 175 | Peugeot 3008 | 92 | 0.1% | + 67.3% | 179 | 899 | 0.1% | + 33.6% | 162 | 171 |
| 176 | Jetour T1 | 90 | 0.1% | + 200.0% | 155 | 930 | 0.1% | + 2900.0% | 160 | 274 |
| 177 | JAC 6 | 88 | 0.1% | + 125.6% | 170 | 732 | 0.1% | + 171.1% | 177 | 235 |
| 178 | Chevrolet Traverse | 86 | 0.1% | – 26.5% | 160 | 799 | 0.1% | – 22.4% | 170 | 161 |
| 179 | Lexus NX | 85 | 0.1% | + 16.4% | 177 | 630 | 0.1% | + 6.2% | 193 | 189 |
| 180 | VW Nivus | 85 | 0.1% | – 57.1% | 205 | 877 | 0.1% | – 46.1% | 163 | 121 |
| 181 | JAC X350 | 83 | 0.1% | – 3.5% | 184 | 719 | 0.1% | – 8.8% | 180 | 176 |
| 182 | Mitsubishi Mirage G4 | 82 | 0.1% | – 56.1% | 191 | 1,272 | 0.1% | – 26.0% | 129 | 128 |
| 183 | Audi A5 | 81 | 0.1% | – 25.0% | 190 | 669 | 0.1% | + 53.4% | 187 | 200 |
| 184 | Ford Bronco | 79 | 0.1% | + 6.8% | 197 | 680 | 0.1% | + 0.1% | 185 | 188 |
| 185 | Chevrolet Tahoe | 77 | 0.1% | – 54.7% | 159 | 992 | 0.1% | – 17.5% | 157 | 139 |
| 186 | Changan UNI-K | 76 | 0.1% | + 0.0% | 270 | 367 | 0.0% | – 19.5% | 226 | 214 |
| 187 | VW Golf/GTI | 74 | 0.1% | – 7.5% | 174 | 750 | 0.1% | – 28.3% | 175 | 166 |
| 188 | Honda Odyssey | 73 | 0.1% | – 33.6% | 168 | 627 | 0.1% | – 32.4% | 195 | 167 |
| 189 | Jeep Gladiator | 73 | 0.1% | – 45.1% | 181 | 743 | 0.1% | – 20.4% | 176 | 162 |
| 190 | Ford Explorer | 72 | 0.1% | – 79.7% | 139 | 1,174 | 0.1% | – 57.3% | 139 | 88 |
| 191 | BMW 3 Series | 71 | 0.1% | + 7.6% | 176 | 689 | 0.1% | + 29.8% | 184 | 207 |
| 192 | Volvo XC60 | 69 | 0.1% | – 36.7% | 204 | 646 | 0.1% | – 17.3% | 191 | 174 |
| 193 | Foton Tunland | 67 | 0.1% | – 31.6% | 225 | 401 | 0.0% | – 42.2% | 216 | 205 |
| 194 | Peugeot Manager | 67 | 0.1% | – 33.0% | 165 | 714 | 0.1% | – 18.5% | 181 | 173 |
| 195 | Mini Countryman | 66 | 0.1% | – 14.3% | 206 | 589 | 0.1% | – 12.7% | 198 | 185 |
| 196 | Lexus RX | 63 | 0.0% | + 75.0% | 202 | 447 | 0.0% | + 28.1% | 212 | 233 |
| 197 | Mercedes GLB | 61 | 0.0% | – 6.2% | 175 | 497 | 0.0% | + 35.1% | 207 | 239 |
| 198 | Ford Mustang | 60 | 0.0% | – 7.7% | 193 | 537 | 0.1% | – 10.1% | 203 | 203 |
| 199 | Porsche Macan | 60 | 0.0% | + 62.2% | 188 | 586 | 0.1% | + 12.5% | 199 | 213 |
| 200 | Zeekr 7X | 60 | 0.0% | new | 182 | 776 | 0.1% | new | 172 | – |
| 201 | BMW X6 | 58 | 0.0% | – 43.7% | 192 | 600 | 0.1% | – 21.4% | 196 | 170 |
| 202 | BMW 4 Series | 57 | 0.0% | + 0.0% | 231 | 368 | 0.0% | – 19.5% | 225 | 215 |
| 203 | GMC Acadia | 57 | 0.0% | – 17.4% | 199 | 478 | 0.0% | – 33.6% | 209 | 184 |
| 204 | MG RX9 | 57 | 0.0% | + 850.0% | 203 | 504 | 0.0% | + 103.2% | 205 | 291 |
| 205 | Volvo EX30 | 57 | 0.0% | – 82.1% | 198 | 827 | 0.1% | – 64.9% | 167 | 97 |
| 206 | Nissan Frontier | 56 | 0.0% | – 72.8% | 180 | 600 | 0.1% | – 37.2% | 197 | 169 |
| 207 | Porsche Cayenne | 56 | 0.0% | + 14.3% | 173 | 579 | 0.1% | – 12.5% | 200 | 191 |
| 208 | Jetour Dashing | 54 | 0.0% | + 315.4% | 161 | 756 | 0.1% | + 177.9% | 174 | 280 |
| 209 | Lexus GX | 54 | 0.0% | + 170.0% | 210 | 306 | 0.0% | + 109.6% | 240 | 305 |
| 210 | Alfa Romeo Junior | 53 | 0.0% | new | 239 | 246 | 0.0% | new | 258 | – |
| 211 | Toyota GR Yaris | 53 | 0.0% | + 120.8% | 227 | 123 | 0.0% | – 45.8% | 297 | 278 |
| 212 | Ford Expedition | 51 | 0.0% | – 28.2% | 200 | 502 | 0.0% | – 12.2% | 206 | 197 |
| 213 | Jeep Commander | 51 | 0.0% | – 75.1% | 169 | 628 | 0.1% | – 57.9% | 194 | 124 |
| 214 | Renault Master | 51 | 0.0% | + 240.0% | 271 | 395 | 0.0% | – 32.4% | 218 | 227 |
| 215 | Nissan Pathfinder | 50 | 0.0% | – 53.7% | 213 | 351 | 0.0% | – 36.1% | 228 | 221 |
| 216 | Peugeot 5008 | 50 | 0.0% | n/a | 196 | 374 | 0.0% | n/a | 224 | 322 |
| 217 | Buick Envision | 48 | 0.0% | + 14.3% | 245 | 274 | 0.0% | – 34.8% | 250 | 234 |
| 218 | Fiat Fastback | 48 | 0.0% | – 48.4% | 221 | 563 | 0.1% | – 12.2% | 201 | 190 |
| 219 | Isuzu D-Max | 48 | 0.0% | n/a | – | 48 | 0.0% | n/a | 347 | – |
| 220 | Peugeot Expert | 48 | 0.0% | – 2.0% | 187 | 678 | 0.1% | + 101.2% | 186 | 216 |
| 221 | BMW 1 Series | 47 | 0.0% | – 6.0% | 236 | 333 | 0.0% | – 43.3% | 234 | 208 |
| 222 | Hyundai Palisade | 46 | 0.0% | + 318.2% | 201 | 401 | 0.0% | + 301.0% | 217 | 282 |
| 223 | Kia Niro | 46 | 0.0% | – 55.3% | 207 | 481 | 0.0% | – 23.7% | 208 | 194 |
| 224 | Toyota Sequoia | 46 | 0.0% | + 7.0% | 189 | 387 | 0.0% | + 64.7% | 222 | 237 |
| 225 | Changan CS75 | 45 | 0.0% | – 54.1% | 220 | 812 | 0.1% | + 190.0% | 169 | 218 |
| 226 | Toyota Tundra | 43 | 0.0% | + 13.2% | 233 | 405 | 0.0% | – 9.0% | 215 | 211 |
| 227 | Range Rover Sport | 42 | 0.0% | – 22.2% | 229 | 389 | 0.0% | – 21.9% | 220 | 212 |
| 228 | Foton View | 41 | 0.0% | n/a | 247 | 201 | 0.0% | – 8.2% | 268 | 260 |
| 229 | Chevrolet Express/Max | 40 | 0.0% | – 60.8% | 223 | 669 | 0.1% | + 33.8% | 188 | 186 |
| 230 | Land Rover Defender | 40 | 0.0% | + 11.1% | 235 | 411 | 0.0% | + 12.6% | 214 | 244 |
| 231 | Mercedes C-Class | 40 | 0.0% | + 100.0% | 277 | 236 | 0.0% | – 22.6% | 260 | 262 |
| 232 | Lynk & Co 02 | 38 | 0.0% | new | 218 | 172 | 0.0% | new | 278 | – |
| 233 | Subaru Outback | 38 | 0.0% | + 442.9% | 224 | 332 | 0.0% | + 201.8% | 236 | 351 |
| 234 | Volvo XC90 | 38 | 0.0% | + 11.8% | 249 | 285 | 0.0% | – 12.8% | 244 | 241 |
| 235 | Foton Hi-Van | 36 | 0.0% | n/a | 276 | 194 | 0.0% | + 88.3% | 273 | 347 |
| 236 | Foton TM 3 | 36 | 0.0% | – 74.8% | 367 | 158 | 0.0% | – 70.0% | 282 | 230 |
| 237 | Lynk & Co 01 | 36 | 0.0% | new | 237 | 199 | 0.0% | new | 271 | – |
| 238 | Mini E | 36 | 0.0% | + 56.5% | 292 | 274 | 0.0% | + 94.3% | 251 | 286 |
| 239 | GMC Yukon | 35 | 0.0% | + 2.9% | 234 | 341 | 0.0% | – 30.4% | 232 | 217 |
| 240 | JAC 2 | 35 | 0.0% | – 83.1% | 222 | 790 | 0.1% | – 59.3% | 171 | 109 |
| 241 | JAC Sei2 | 35 | 0.0% | + 191.7% | 195 | 279 | 0.0% | – 21.0% | 247 | 258 |
| 242 | Geely GX3 Pro | 34 | 0.0% | – 30.6% | 256 | 284 | 0.0% | – 60.7% | 245 | 195 |
| 243 | Mazda CX-70 | 34 | 0.0% | n/a | 212 | 340 | 0.0% | – 16.3% | 233 | 245 |
| 244 | Cadillac Escalade | 31 | 0.0% | – 13.9% | 214 | 344 | 0.0% | – 28.8% | 231 | 220 |
| 245 | Infiniti QX65 | 31 | 0.0% | new | 208 | 80 | 0.0% | new | 322 | – |
| 246 | Audi Q8 | 30 | 0.0% | + 11.1% | 255 | 251 | 0.0% | – 20.6% | 257 | 247 |
| 247 | BMW iX3 | 30 | 0.0% | + 900.0% | 209 | 151 | 0.0% | + 287.2% | 283 | 387 |
| 248 | Cadillac Escalade ESV | 30 | 0.0% | – 21.1% | 228 | 350 | 0.0% | – 27.1% | 229 | 226 |
| 249 | Infiniti QX60 | 30 | 0.0% | – 23.1% | 242 | 385 | 0.0% | + 42.6% | 223 | 257 |
| 250 | Mercedes GLA | 30 | 0.0% | – 47.4% | 283 | 201 | 0.0% | – 35.2% | 269 | 249 |
| 251 | Range Rover Evoque | 30 | 0.0% | – 23.1% | 296 | 204 | 0.0% | – 30.1% | 266 | 270 |
| 252 | GMC Yukon XL | 29 | 0.0% | – 37.0% | 248 | 314 | 0.0% | – 32.2% | 239 | 222 |
| 253 | Hyundai Santa Fe | 29 | 0.0% | – 53.2% | 226 | 452 | 0.0% | – 21.7% | 211 | 210 |
| 254 | Kia Telluride | 29 | 0.0% | + 45.0% | 259 | 124 | 0.0% | – 59.2% | 296 | 275 |
| 255 | Soueast S08 | 29 | 0.0% | new | 252 | 78 | 0.0% | new | 324 | – |
| 256 | Soueast S09 | 29 | 0.0% | + 107.1% | 268 | 112 | 0.0% | + 300.0% | 308 | 361 |
| 257 | Audi A1 | 26 | 0.0% | – 60.0% | 250 | 266 | 0.0% | – 34.5% | 252 | 225 |
| 258 | Dodge Charger | 26 | 0.0% | – 67.9% | 324 | 42 | 0.0% | – 60.0% | 358 | 350 |
| 259 | Buick Enclave | 25 | 0.0% | – 37.5% | 219 | 328 | 0.0% | – 18.2% | 237 | 229 |
| 260 | MG 4 | 25 | 0.0% | + 13.6% | 377 | 286 | 0.0% | + 47.4% | 243 | 281 |
| 261 | JAC X200 | 24 | 0.0% | – 41.5% | 216 | 278 | 0.0% | – 18.7% | 248 | 243 |
| 262 | Zeekr 001 | 24 | 0.0% | new | 257 | 216 | 0.0% | new | 263 | – |
| 263 | IM LS7 | 23 | 0.0% | – 36.1% | 264 | 177 | 0.0% | + 78.8% | 275 | 299 |
| 264 | Toyota GR Corolla | 23 | 0.0% | new | 357 | 121 | 0.0% | new | 301 | – |
| 265 | BMW iX2 | 22 | 0.0% | – 12.0% | 317 | 159 | 0.0% | + 2.6% | 280 | 294 |
| 266 | Mini Aceman | 22 | 0.0% | + 15.8% | 251 | 256 | 0.0% | + 57.1% | 256 | 284 |
| 267 | Subaru Impreza/WRX | 21 | 0.0% | + 5.0% | 253 | 176 | 0.0% | + 9.3% | 276 | 297 |
| 268 | BMW 5 Series | 20 | 0.0% | + 42.9% | 288 | 122 | 0.0% | + 9.9% | 298 | 331 |
| 269 | Chevrolet Equinox EV | 20 | 0.0% | + 17.6% | 246 | 208 | 0.0% | + 29.2% | 265 | 311 |
| 270 | Honda Accord | 20 | 0.0% | – 67.7% | 241 | 345 | 0.0% | – 38.1% | 230 | 209 |
| 271 | Lincoln Navigator | 20 | 0.0% | – 76.2% | 211 | 326 | 0.0% | – 2.1% | 238 | 256 |
| 272 | Dodge Durango | 19 | 0.0% | – 74.0% | 240 | 475 | 0.0% | + 47.5% | 210 | 265 |
| 273 | Mercedes E-Class | 19 | 0.0% | + 46.2% | 294 | 139 | 0.0% | – 36.5% | 286 | 287 |
| 274 | BMW X7 | 18 | 0.0% | – 37.9% | 261 | 159 | 0.0% | – 36.1% | 281 | 266 |
| 275 | Lexus ES | 18 | 0.0% | + 80.0% | 372 | 27 | 0.0% | – 73.0% | 378 | 333 |
| 276 | Lexus UX | 18 | 0.0% | – 25.0% | 267 | 172 | 0.0% | – 34.1% | 277 | 259 |
| 277 | Mercedes A-Class | 18 | 0.0% | – 37.9% | 266 | 199 | 0.0% | – 46.8% | 272 | 240 |
| 278 | Soueast S06 | 18 | 0.0% | – 37.9% | 232 | 282 | 0.0% | + 403.6% | 246 | 320 |
| 279 | Ford Mustang Mach-E | 17 | 0.0% | + 183.3% | 301 | 112 | 0.0% | + 13.1% | 307 | 338 |
| 280 | Seat Ateca | 17 | 0.0% | – 63.0% | 281 | 262 | 0.0% | – 69.5% | 253 | 182 |
| 281 | BMW iX1 | 16 | 0.0% | – 33.3% | 306 | 126 | 0.0% | – 16.0% | 293 | 292 |
| 282 | Mercedes CLA | 16 | 0.0% | – 36.0% | 244 | 387 | 0.0% | + 20.2% | 221 | 250 |
| 283 | Geely Starray | 15 | 0.0% | – 54.5% | 262 | 357 | 0.0% | – 61.4% | 227 | 178 |
| 284 | Infiniti QX80 | 15 | 0.0% | + 15.4% | 279 | 149 | 0.0% | – 22.0% | 285 | 295 |
| 285 | Soueast S07 | 15 | 0.0% | – 31.8% | 297 | 80 | 0.0% | + 35.6% | 323 | 313 |
| 286 | Subaru BRZ | 15 | 0.0% | + 7.1% | 298 | 133 | 0.0% | – 17.4% | 289 | 309 |
| 287 | Alfa Romeo Tonale | 14 | 0.0% | – 17.6% | 320 | 50 | 0.0% | – 53.3% | 345 | 314 |
| 288 | Lexus IS | 14 | 0.0% | + 600.0% | 285 | 71 | 0.0% | + 115.2% | 327 | 397 |
| 289 | Lynk & Co 900 | 14 | 0.0% | new | – | 14 | 0.0% | new | 391 | – |
| 290 | Mercedes G-Class | 14 | 0.0% | – 6.7% | 238 | 220 | 0.0% | – 15.4% | 262 | 272 |
| 291 | Mercedes GLS | 14 | 0.0% | + 75.0% | 295 | 131 | 0.0% | – 38.2% | 290 | 289 |
| 292 | Buick Encore | 13 | 0.0% | – 58.1% | 272 | 210 | 0.0% | – 34.2% | 264 | 253 |
| 293 | JAC E10X | 13 | 0.0% | + 62.5% | 318 | 116 | 0.0% | – 70.8% | 304 | 242 |
| 294 | Lincoln Corsair | 13 | 0.0% | – 62.9% | 217 | 202 | 0.0% | – 28.6% | 267 | 261 |
| 295 | Lynk & Co 09 | 13 | 0.0% | new | 303 | 86 | 0.0% | new | 320 | – |
| 296 | Zeekr X | 13 | 0.0% | new | 275 | 258 | 0.0% | new | 254 | – |
| 297 | JAC E30X | 12 | 0.0% | + 50.0% | 314 | 71 | 0.0% | – 47.4% | 326 | 325 |
| 298 | Audi Q2 | 11 | 0.0% | – 83.8% | 243 | 275 | 0.0% | – 30.2% | 249 | 232 |
| 299 | Audi Q7 | 11 | 0.0% | – 57.7% | 300 | 124 | 0.0% | – 61.6% | 295 | 254 |
| 300 | GWM Haval H7 | 11 | 0.0% | new | – | 11 | 0.0% | new | 399 | – |
| 301 | Mercedes CLE | 11 | 0.0% | – 26.7% | 280 | 108 | 0.0% | – 37.2% | 309 | 304 |
| 302 | Acura Integra | 10 | 0.0% | + 150.0% | 315 | 65 | 0.0% | + 16.1% | 330 | 360 |
| 303 | Acura RDX | 10 | 0.0% | – 58.3% | 309 | 95 | 0.0% | – 37.5% | 313 | 300 |
| 304 | Audi Q6 e-Tron | 10 | 0.0% | + 66.7% | 316 | 88 | 0.0% | – 16.2% | 318 | 334 |
| 305 | Chevrolet Blazer | 10 | 0.0% | – 66.7% | 282 | 128 | 0.0% | – 57.2% | 291 | 252 |
| 306 | GWM Tank 500 | 10 | 0.0% | – 54.5% | 273 | 151 | 0.0% | – 26.0% | 284 | 290 |
| 307 | Lexus TX | 10 | 0.0% | – 44.4% | 265 | 113 | 0.0% | – 18.7% | 306 | 303 |
| 308 | Lincoln Aviator | 10 | 0.0% | – 33.3% | 326 | 60 | 0.0% | – 40.0% | 334 | 318 |
| 309 | MG P9 | 10 | 0.0% | new | – | 107 | 0.0% | new | 310 | – |
| 310 | Volvo C40 | 10 | 0.0% | – 52.4% | 293 | 120 | 0.0% | – 47.1% | 302 | 285 |
| 311 | Acura ADX | 9 | 0.0% | – 35.7% | 304 | 200 | 0.0% | + 83.5% | 270 | 329 |
| 312 | GMC Hummer EV SUV | 9 | 0.0% | – 18.2% | 343 | 71 | 0.0% | – 4.1% | 325 | 355 |
| 313 | Range Rover | 9 | 0.0% | – 25.0% | 278 | 104 | 0.0% | + 13.0% | 311 | 332 |
| 314 | GMC Hummer EV Pickup | 8 | 0.0% | + 0.0% | 327 | 47 | 0.0% | – 23.0% | 348 | 358 |
| 315 | Jeep Wagoneer | 8 | 0.0% | – 33.3% | 302 | 137 | 0.0% | + 1.5% | 287 | 316 |
| 316 | MG 7 | 8 | 0.0% | – 55.6% | 354 | 392 | 0.0% | + 60.0% | 219 | 279 |
| 317 | Acura MDX | 7 | 0.0% | – 30.0% | 305 | 80 | 0.0% | – 48.1% | 321 | 307 |
| 318 | Alfa Romeo Giulia | 7 | 0.0% | + 133.3% | 349 | 29 | 0.0% | + 0.0% | 377 | 379 |
| 319 | Cadillac Optiq | 7 | 0.0% | + 0.0% | 323 | 90 | 0.0% | + 76.5% | 316 | 357 |
| 320 | Foton S3 | 7 | 0.0% | + 600.0% | 230 | 185 | 0.0% | + 131.3% | 274 | 298 |
| 321 | GWM Tank 300 | 7 | 0.0% | – 87.3% | 291 | 237 | 0.0% | – 49.4% | 259 | 198 |
| 322 | Land Rover Discovery Sport | 7 | 0.0% | + 133.3% | 334 | 40 | 0.0% | + 2.6% | 360 | 371 |
| 323 | Lexus LX | 7 | 0.0% | – 61.1% | 286 | 121 | 0.0% | – 3.2% | 300 | 308 |
| 324 | Volvo EX90 | 7 | 0.0% | – 22.2% | 319 | 24 | 0.0% | – 64.2% | 383 | 363 |
| 325 | BMW i5 | 6 | 0.0% | – 50.0% | 330 | 46 | 0.0% | – 41.0% | 349 | 354 |
| 326 | Changan CS95 | 6 | 0.0% | – 60.0% | 332 | 54 | 0.0% | – 8.5% | 338 | 346 |
| 327 | JAC Traveler | 6 | 0.0% | – 50.0% | 260 | 256 | 0.0% | + 216.0% | 255 | 330 |
| 328 | MG One | 6 | 0.0% | – 99.3% | – | 14 | 0.0% | – 99.4% | 393 | 75 |
| 329 | MG RX8 | 6 | 0.0% | – 45.5% | 379 | 64 | 0.0% | – 74.6% | 333 | 263 |
| 330 | Porsche Panamera | 6 | 0.0% | + 50.0% | 380 | 38 | 0.0% | + 0.0% | 363 | 372 |
| 331 | Alfa Romeo Stelvio | 5 | 0.0% | – 28.6% | 338 | 30 | 0.0% | – 14.3% | 376 | 368 |
| 332 | Audi A6 | 5 | 0.0% | – 80.0% | 287 | 94 | 0.0% | + 4.4% | 315 | 337 |
| 333 | BMW iX | 5 | 0.0% | – 54.5% | 310 | 122 | 0.0% | + 1.7% | 299 | 326 |
| 334 | Cadillac Escalade IQ | 5 | 0.0% | new | 321 | 59 | 0.0% | new | 336 | – |
| 335 | Jetour X70 Plus | 5 | 0.0% | – 16.7% | 311 | 53 | 0.0% | – 49.0% | 341 | 345 |
| 336 | Mercedes Vito | 5 | 0.0% | – 92.3% | 312 | 37 | 0.0% | – 66.4% | 365 | 344 |
| 337 | Suzuki Baleno | 5 | 0.0% | – 96.1% | 269 | 1,109 | 0.1% | – 8.3% | 145 | 137 |
| 338 | Chevrolet Cavalier | 4 | 0.0% | – 63.6% | 307 | 98 | 0.0% | – 52.7% | 312 | 301 |
| 339 | Chevrolet Corvette | 4 | 0.0% | + 0.0% | – | 53 | 0.0% | – 14.5% | 340 | 349 |
| 340 | GWM P300 | 4 | 0.0% | new | – | 4 | 0.0% | new | 415 | – |
| 341 | Mercedes AMG GT | 4 | 0.0% | – 42.9% | 346 | 38 | 0.0% | + 137.5% | 362 | 396 |
| 342 | Chevrolet Blazer EV | 3 | 0.0% | – 76.9% | 313 | 46 | 0.0% | – 35.2% | 351 | 359 |
| 343 | Dodge Journey | 3 | 0.0% | – 99.5% | – | 69 | 0.0% | – 97.0% | 328 | 65 |
| 344 | Fiat Mobi | 3 | 0.0% | + 0.0% | – | 3 | 0.0% | – 99.5% | 416 | 236 |
| 345 | Foton S3 EV | 3 | 0.0% | – 57.1% | 341 | 44 | 0.0% | + 144.4% | 354 | 389 |
| 346 | Foton Wonder/EV | 3 | 0.0% | + 200.0% | 333 | 33 | 0.0% | + 50.0% | 371 | 403 |
| 347 | Geely Okavango | 3 | 0.0% | – 66.7% | 351 | 34 | 0.0% | – 79.9% | 368 | 315 |
| 348 | Mercedes S-Class | 3 | 0.0% | + 0.0% | 335 | 43 | 0.0% | + 72.0% | 357 | 385 |
| 349 | Nissan Z | 3 | 0.0% | – 57.1% | 355 | 39 | 0.0% | + 62.5% | 361 | 395 |
| 350 | BMW i4 | 2 | 0.0% | – 33.3% | 329 | 59 | 0.0% | – 38.5% | 335 | 342 |
| 351 | BMW XM | 2 | 0.0% | – 33.3% | 331 | 32 | 0.0% | – 20.0% | 372 | 369 |
| 352 | BMW Z4 | 2 | 0.0% | – 86.7% | 289 | 136 | 0.0% | + 97.1% | 288 | 348 |
| 353 | Jetour X70 | 2 | 0.0% | – 84.6% | 353 | 69 | 0.0% | – 45.7% | 329 | 317 |
| 354 | Mercedes EQS SUV | 2 | 0.0% | – 50.0% | – | 17 | 0.0% | – 54.1% | 388 | 381 |
| 355 | MG Cyberster | 2 | 0.0% | – 66.7% | 378 | 49 | 0.0% | + 0.0% | 346 | 365 |
| 356 | Porsche Taycan | 2 | 0.0% | + 100.0% | 328 | 31 | 0.0% | – 22.5% | 375 | 377 |
| 357 | Range Rover Velar | 2 | 0.0% | – 80.0% | 274 | 114 | 0.0% | + 25.3% | 305 | 341 |
| 358 | Subaru Trailseeker | 2 | 0.0% | new | 299 | 24 | 0.0% | new | 382 | – |
| 359 | VW ID.4 | 2 | 0.0% | – 84.6% | 337 | 52 | 0.0% | + 57.6% | 344 | 364 |
| 360 | Bentley Flying Spur | 1 | 0.0% | + 0.0% | – | 2 | 0.0% | + 100.0% | 421 | 437 |
| 361 | BMW 7 Series | 1 | 0.0% | – 50.0% | 361 | 25 | 0.0% | – 30.6% | 380 | 384 |
| 362 | BMW X4 | 1 | 0.0% | – 97.9% | 363 | 89 | 0.0% | – 83.6% | 317 | 196 |
| 363 | Cadillac Lyriq | 1 | 0.0% | n/a | 350 | 26 | 0.0% | – 39.5% | 379 | 374 |
| 364 | Cadillac XT4 | 1 | 0.0% | – 94.7% | 364 | 36 | 0.0% | – 74.6% | 366 | 319 |
| 365 | Cadillac XT5 | 1 | 0.0% | – 88.9% | 365 | 10 | 0.0% | – 81.5% | 400 | 367 |
| 366 | Fiat Argo | 1 | 0.0% | – 98.8% | 366 | 56 | 0.0% | – 91.9% | 337 | 192 |
| 367 | Foton Hi-Van EV | 1 | 0.0% | n/a | – | 11 | 0.0% | + 1000.0% | 398 | 439 |
| 368 | Honda Prelude | 1 | 0.0% | new | 352 | 65 | 0.0% | new | 331 | – |
| 369 | JAC J7 | 1 | 0.0% | – 87.5% | – | 24 | 0.0% | – 91.5% | 381 | 283 |
| 370 | JAC Sei4 Pro | 1 | 0.0% | – 97.2% | 370 | 17 | 0.0% | – 85.8% | 387 | 339 |
| 371 | Lexus LC | 1 | 0.0% | n/a | 345 | 13 | 0.0% | + 62.5% | 394 | 409 |
| 372 | Mercedes EQA | 1 | 0.0% | – 66.7% | 373 | 31 | 0.0% | + 24.0% | 374 | 392 |
| 373 | Mercedes EQC | 1 | 0.0% | – 50.0% | – | 14 | 0.0% | + 180.0% | 392 | 417 |
| 374 | MG RX5 | 1 | 0.0% | – 99.8% | – | 1,112 | 0.1% | – 37.4% | 144 | 79 |
| 375 | Peugeot E-Partner | 1 | 0.0% | – 92.3% | – | 32 | 0.0% | – 61.9% | 373 | 268 |
| 376 | Ram ProMaster | 1 | 0.0% | – 75.0% | 215 | 332 | 0.0% | + 69.4% | 235 | 296 |
| 377 | Toyota Supra | 1 | 0.0% | – 80.0% | 347 | 38 | 0.0% | + 72.7% | 364 | 386 |
Source: INEGI