
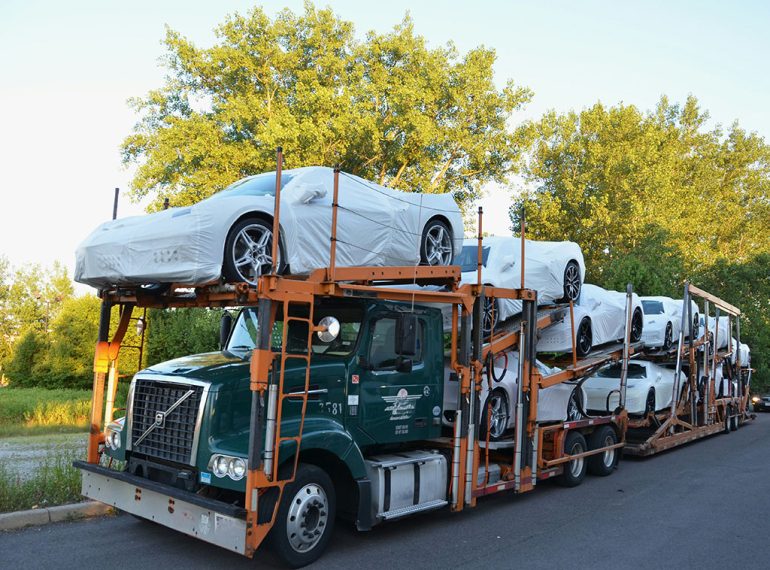
Consumer car shipping prices rose 14.6% in the first half of 2026 against the same period last year, according to 30 months of booking data published by SGT Auto Transport. What carriers were paid rose faster: up 22.8%. The gap between those two numbers is the whole story of the auto transport market right now.
The SGT Auto Transport dataset runs January 2024 through June 2026, covers all 50 states and 1,581 state-to-state lanes, and is mix-adjusted so a shift in which routes people book doesn’t get mistaken for real price movement. It is also consumer data rather than dealer logistics: 76.9% of pickups happen at a residential address. If you are moving your own car this year, this is what the road looks like.
For two years, nothing moved. Carrier pay per mile sat in a narrow band through all of 2024 and 2025. Then the Strait of Hormuz closed on March 2, 2026, and diesel went from $3.72 a gallon in February to $5.60 at its May peak. The first-half average landed at $4.72 against $3.59 a year earlier, 31% higher.
Rates tracked fuel almost month for month. Year-over-year increases ran 9.2% in January, 14.9% in March, 32.8% in May and 34.7% in June. That is not a market repricing on demand. That is a market repricing on the cost of a gallon.
Per-mile pricing collapses with distance, which is the single most useful thing to understand before you request a quote.
| Distance | Avg. price per mile | Typical total |
| 100-499 mi | $2.04 | ~$623 |
| 500-749 mi | $1.30 | ~$824 |
| 750-999 mi | $1.11 | ~$964 |
| 1,000-1,499 mi | $0.89 | ~$1,112 |
| 1,500-1,999 mi | $0.75 | ~$1,289 |
| 2,000-2,499 mi | $0.63 | ~$1,414 |
| 2,500+ mi | $0.55 | ~$1,534 |
Short hauls cost 3.7 times more per mile than long ones, but only 2.46 times more in total. Loading, inspection, paperwork and the driver’s time at each end cost the same whether the car travels 330 miles or 2,800. Distance is cheap. Stops are expensive. A 400-mile move is the worst value per mile in the market, and the one most likely to be cheaper driven.
Enclosed trailers ran 32.3% above open transport overall, but the spread depends heavily on distance: 21.3% under 500 miles, 38.9% in the 1,500 to 2,000 mile band. Enclosed capacity is scarce and carries fewer cars per load, so the longer the haul, the more that scarcity shows up in the price. Budget toward the top of that range for a collector car crossing the country.
Two numbers deserve more attention than they usually get. Repricing after booking rose 46%. Cancellations rose 24.8%, climbing from 1.45% to 4.64% of all bookings.
Both come from the same squeeze. Brokers absorbed much of the fuel shock, which is why consumers saw 14.6% while carriers got 22.8%. The consequence is that some quotes stopped clearing the market before a truck ever accepted the load. A rate that looked competitive on Monday could sit unclaimed by Thursday.
Booking behavior makes this worse. Some 38.5% of customers now book within two days of their needed pickup, up from 34.9%, while bookings made 30 days out slipped to 11.6%. Short notice in a tight capacity market is exactly how you land in the repricing bucket. If your date is fixed, lead time is the cheapest protection available.
Vehicle flow does not follow the moving-truck narrative. Ranked by inbound shipments per outbound, Utah leads at 1.37, followed by South Carolina at 1.25, Illinois at 1.19, and Arizona and Texas at 1.17. On the other side: New Jersey at 0.76, Oregon at 0.77, Washington at 0.79, Massachusetts at 0.87 and California at 0.91.
Illinois is the anomaly worth flagging. It swung from 0.91 to 1.19 in a single year while U-Haul’s index still shows people leaving the state. Cars and households move for different reasons: dealer stock, auction purchases and vehicles following buyers rather than movers all shift metal without shifting addresses.
Florida behaves less like a state than a tide. Its inbound-to-outbound ratio peaked at 2.25 in October 2025 and bottomed at 0.44 in April 2026, a fivefold seasonal reversal. Anyone shipping against that flow, out of Florida in the fall or into it in the spring, is filling a truck that would otherwise run light.
SUVs took 43.9% of volume, sedans 27.9%, pickups 8.4%, vans 2.8%, and motorcycles, ATVs and RVs a combined 1.1%. EVs reached 5.5% of shipped vehicles, up from 4.4%, with Tesla alone at 3.8%. Cox Automotive put EVs at roughly 4% of Manheim auction volume at mid-year, so EVs are shipping at a higher rate than they trade at wholesale.
Fuel decides 2027, and nobody in this industry controls it. Underneath it, the cost floor keeps rising: the American Transportation Research Institute put average truck operating cost at $2.336 per mile in 2025, with insurance up another 6.4% in the first quarter of 2026.
The broker margin squeeze cannot hold indefinitely. Either consumer prices catch up to carrier pay, or carrier supply thins until they do. Regulation is moving too. The Supreme Court’s decision in Montgomery v. Caribe Transport II left the door open for state negligent-hiring claims against brokers, and FMCSA’s broker transparency rulemaking is still pending.
For anyone shipping a car in the meantime, the takeaways are unglamorous and effective: book early, treat an unusually low quote as a risk rather than a win, and remember that the longer the trip, the better the value per mile.
Data in this article comes from SGT Auto Transport’s State of Auto Transport 2026 report, based on 30 months of first-party shipment records from January 2024 through June 2026.