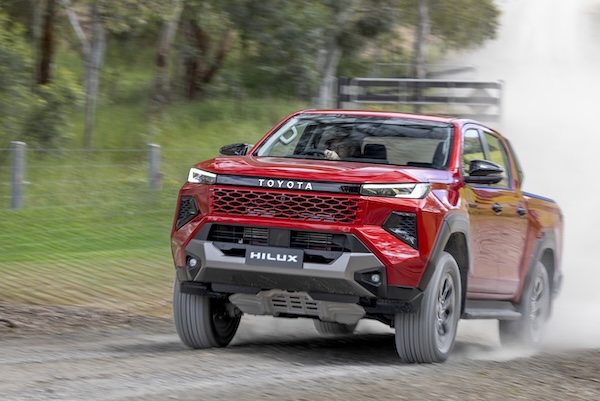
 Toyota Hilux sales are up 19.5% year-on-year in August.
12,216 new vehicles found a buyer in New Zealand in August, a 4.1% year-on-year uptick. The year-to-date volume is now up 9.9% to 95,385. Passenger Cars (Cars and SUVs) are up 12.9% to 9,137 whereas commercial vehicles sink -15.6% to 3,079. Year-to-date, PCs are up 14.9% to 69,360 and commercials down -2% to 26,025.
Toyota (+18.4%) cements its status as the country’s favourite carmaker with a stunning 28.7% share vs. 21% so far this year, and its highest since October 2025 (29.9%). Mitsubishi (+10.9%) is back up to 2nd place with 10.3% share, well above the 8.6% it commands year-to-date (#3). It pushes a freefalling Ford (-45.4%) down to #3. Kia (-2.9%) and Mazda (-10.3%) also struggle but GWM (+18.6%) is strong at #6. Notice also Chery (+142.6%) breaking into the Top 10 for the first time at #10. Jaecoo (+142%) and Audi (+36.2%) also shine below.
Model-wise, the Toyota Hilux (+19.5%) is back in charge for the first time since last March with 7.3% share, that’s almost two percentage points of share above its year-to-date level (#2). The Toyota RAV4 (-14.7%) lurks just four sales below at 7.3% of the market also vs. 5% so far this year. The Ford Ranger (-41.6%) endures a mediocre month and falls to #3 but easily retains the YTD pole position. Excellent performance by the Toyota Corolla Cross (+259.6%) at #4, ahead of the Mitsubishi ASX (+19.6%) up seven spots on July to #5.
Previous month: New Zealand July 2026: BYD, Chery, Geely and Zeekr break records
One year ago: New Zealand August 2025: Rentals push Toyota RAV4 to first place YTD
Full August 2026 Top 20 brands and Top 20 models below.
New Zealand August 2026 – brands:
| Pos | Brand | Aug-26 | % | /25 | Jul | 2026 | % | /25 | Pos | FY25 |
| 1 | Toyota | 3,502 | 28.7% | + 18.4% | 1 | 20,068 | 21.0% | + 1.7% | 1 | 1 |
| 2 | Mitsubishi | 1,254 | 10.3% | + 10.9% | 4 | 8,215 | 8.6% | – 1.1% | 3 | 3 |
| 3 | Ford | 899 | 7.4% | – 45.4% | 2 | 9,573 | 10.0% | – 1.3% | 2 | 2 |
| 4 | Kia | 860 | 7.0% | – 2.9% | 5 | 6,448 | 6.8% | + 7.3% | 4 | 4 |
| 5 | Mazda | 460 | 3.8% | – 10.3% | 14 | 2,715 | 2.8% | – 6.2% | 9 | 6 |
| 6 | GWM | 351 | 2.9% | + 18.6% | 6 | 3,425 | 3.6% | + 40.1% | 6 | 11 |
| 7 | Suzuki | 346 | 2.8% | – 1.4% | 8 | 2,971 | 3.1% | – 10.4% | 8 | 5 |
| 8 | MG | 344 | 2.8% | + 4.6% | 10 | 3,375 | 3.5% | + 22.6% | 7 | 9 |
| 9 | Honda | 294 | 2.4% | + 20.0% | 12 | 2,229 | 2.3% | – 5.6% | 13 | 12 |
| 10 | Chery | 245 | 2.0% | + 142.6% | 11 | 1,779 | 1.9% | + 676.9% | 14 | 23 |
| 11 | Mercedes | 203 | 1.7% | – 26.4% | 19 | 1,339 | 1.4% | – 8.8% | 16 | 15 |
| 12 | Audi | 177 | 1.4% | + 36.2% | n/a | 1,000 | 1.0% | + 20.8% | 20 | 21 |
| 13 | BMW | 170 | 1.4% | – 2.9% | 20 | 1,222 | 1.3% | – 0.3% | 18 | 17 |
| 14 | Jaecoo | 167 | 1.4% | + 142.0% | 17 | n/a | n/a | n/a | n/a | 24 |
| 15 | Subaru | 162 | 1.3% | – 2.4% | 13 | 1,379 | 1.4% | – 14.2% | 15 | 14 |
| 16 | Hyundai | 160 | 1.3% | – 55.7% | 9 | 2,380 | 2.5% | – 3.7% | 11 | 8 |
| 17 | Nissan | 156 | 1.3% | – 47.7% | 18 | 2,545 | 2.7% | – 31.5% | 10 | 7 |
| 18 | Volkswagen | 138 | 1.1% | + 2.2% | 21 | 1,234 | 1.3% | – 17.4% | 17 | 13 |
| 19 | Lexus | 121 | 1.0% | + 3.4% | n/a | 985 | 1.0% | – 3.4% | 21 | 19 |
| 20 | LDV | 115 | 0.9% | – 5.7% | n/a | 583 | 0.6% | – 34.2% | 22 | 20 |
New Zealand August 2026 – models:
| Pos | Model | Aug-26 | % | /25 | Jul | 2026 | % | /25 | Pos | FY25 |
| 1 | Toyota Hilux | 890 | 7.3% | + 19.5% | 3 | 5,167 | 5.4% | – 9.5% | 2 | 3 |
| 2 | Toyota RAV4 | 886 | 7.3% | – 14.7% | 2 | 4,810 | 5.0% | – 22.7% | 3 | 1 |
| 3 | Ford Ranger | 571 | 4.7% | – 41.6% | 1 | 6,228 | 6.5% | + 0.4% | 1 | 2 |
| 4 | Toyota Corolla Cross | 507 | 4.2% | + 259.6% | 6 | 2,304 | 2.4% | + 141.0% | 6 | 20 |
| 5 | Mitsubishi ASX | 475 | 3.9% | + 19.6% | 12 | 2,461 | 2.6% | – 13.5% | 5 | 4 |
| 6 | Mitsubishi Outlander | 386 | 3.2% | + 9.3% | 13 | 2,113 | 2.2% | – 6.3% | 8 | 5 |
| 7 | Mitsubishi Triton | 337 | 2.8% | + 28.6% | 5 | 2,605 | 2.7% | + 18.1% | 4 | 7 |
| 8 | Toyota Prado | 243 | 2.0% | + 89.8% | n/a | n/a | n/a | n/a | n/a | 18 |
| 9 | Ford Everest | 223 | 1.8% | – 46.0% | 14 | 1,871 | 2.0% | + 9.2% | 10 | 6 |
| 10 | Toyota Yaris Cross | 222 | 1.8% | + 22.7% | n/a | n/a | n/a | n/a | n/a | 11 |
| 11 | Kia Stonic | 218 | 1.8% | + 77.2% | n/a | n/a | n/a | n/a | n/a | 24 |
| 12 | Mazda CX-5 | 216 | 1.8% | + 66.2% | n/a | n/a | n/a | n/a | n/a | 19 |
| 13 | Toyota Hiace | 194 | 1.6% | + 2.6% | 11 | 1,883 | 2.0% | + 45.6% | 9 | 10 |
| 14 | Kia Seltos | 191 | 1.6% | – 39.4% | 16 | n/a | n/a | n/a | n/a | 8 |
| 15 | Kia Sportage | 186 | 1.5% | n/a | 7 | 1,785 | 1.9% | + 175.5% | 11 | 21 |
| 16 | GWM Haval H6 | 184 | 1.5% | + 22.7% | 8 | 1,711 | 1.8% | + 52.1% | 12 | 17 |
| 17 | Kia Carnival | 153 | 1.3% | n/a | 25 | n/a | n/a | n/a | n/a | n/a |
| 18 | Toyota Corolla | 142 | 1.2% | – 15.0% | 10 | n/a | n/a | n/a | n/a | 13 |
| 19 | MG ZS | 137 | 1.1% | – 14.4% | n/a | 1,354 | 1.4% | + 2.4% | 14 | 12 |
| 20 | Chery Tiggo 4 Pro | 132 | 1.1% | n/a | 20 | n/a | n/a | n/a | n/a | n/a |
| 21 | Suzuki Swift | 112 | 0.9% | – 14.5% | 18 | 1,087 | 1.1% | – 16.6% | n/a | 16 |
| 22 | Suzuki Jimny | 108 | 0.9% | n/a | n/a | n/a | n/a | n/a | n/a | n/a |
| 23 | BYD Atto 3 | 107 | 0.9% | n/a | 17 | n/a | n/a | n/a | n/a | n/a |
Source: Auto Talk