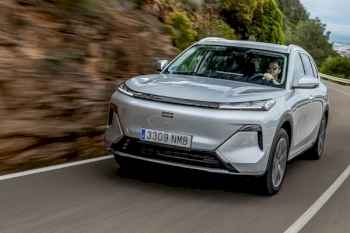
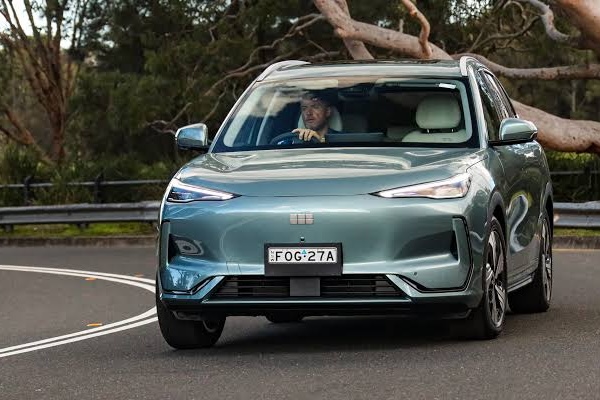
 Geely sales are up 870.3% year-on-year in September.
The Australian new vehicle market is up 1.8% year-on-year in September to 108,778 sales, the second highest ever September result below the 110,702 of September 2023. The year-to-date tally is now up 2% to 957,696 units, a new all time high after 9 months, eclipsing the previous best of 938,959 established just last year. Looking at sales by state and territory (excluding Tesla and Polestar), we have a mixed bag, with Australian Capital Territory (+16.3% to 1,558), Tasmania (+8.5% to 1,911), Victoria (+3.5% to 27,529) and Queensland (+1% to 22,153) up, while South Australia (-0.3% to 6,613), New South Wales (-0.8% to 31,038), Western Australia (-1.6% to 11,305) and Northern Territory (-13.3% to 817) are down. As for sales by country of origin, China is up 63.8% to 42,358 and a whopping 38.9% share, Japan is down -13% to 23,133, Thailand off -15.2% to 17,800, South Korea off -21.5% to 9,892 and Germany down -4.6% to 4,309.
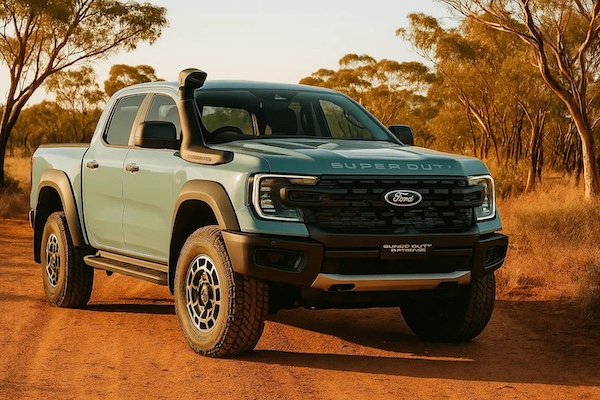 The Ford Ranger is #1 in Australia for the first time since last March.
Including Tesla and Polestar, SUV sales grow 6.3% to 69,712 and 64.1% share vs. 61.4% last year and 58% two years ago, light commercials sink -13.2% to 20,627 and 19% share vs. 22.2% in 2025 and 21.6% in 2024 but passenger cars bounce back up 9.8% to 15,054 and 13.8% share vs. 12.8% a year ago and 15.9% in 2024. Heavy commercials are down -12.6% to 3,385. Private sales are up 3.6% to 51,239, fleets edge down -0.1% to 39,209, rentals are off -0.6% to 6,661 and government sales are down -9.7% to 2,430. For the second month in a row, BEVs are the most successful propulsion type at 24.2% share vs. just 11.3% a year ago (which was a record at the time) thanks to sales up 117.7% to 26,287. BEVs now hold 18.9% of the Australian market through September (180,591 sales). Petrol is down -36.2% to 26,018 and 23.9% share vs. 28.2% YTD. Diesel is off -18.4% to 25,173, HEVs soar 20.5% to 17,843 and 16.4% share and PHEVs are up 124.3% to 10,072 and 9.3% share. This is excluding heavy commercials.
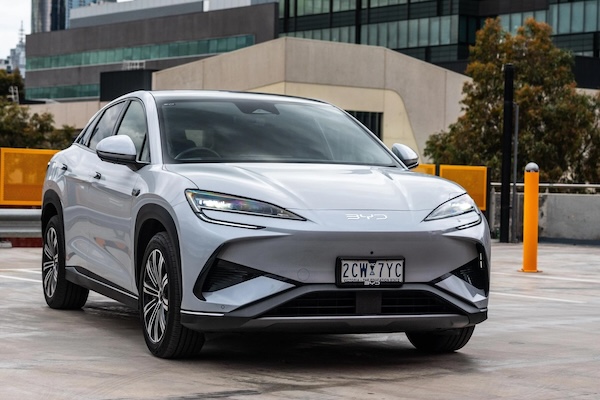 BYD is the second best-selling brand in Australia for the 6th month running.
In the brands ranking, Toyota (-3.5%) can’t capitalise on the positive market but at 16.3% share it is slightly above its YTD level (16%). BYD (+61.1%) confirms it is now the #2 brand in the market (for the 6th consecutive month) even though it trails the 8% it holds YTD. After a dismal August result (-39.8%), Ford climbs back up five spots to #3 with 7% share, also reclaiming the #3 spot YTD. Kia (-19.5%) and Mazda (-18.9%) are both in great difficulty whereas Tesla (+21.3%) and GWM (+5.4%) shine. MG (+16.7%) is also solid at #9 but the best performer in the Top 10 is Geely (+870.3%) repeating at a record #10 and 4.1% share. Chery (+21.8%) lurks just behind at #11, with Omoda Jaecoo (+344.2%) and Zeekr (+1608.3%) shooting up.
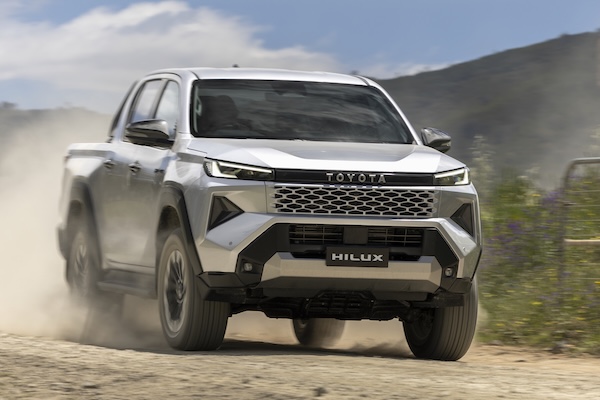 Disappointing result for the Toyota Hilux (#4).
Over in the models charts, the Ford Ranger (+4%) reclaims the top spot for the first time since last March after a stop-sale throttled August volumes, and cements its YTD dominance. The Toyota RAV4 (+81%) benefits from the availability of the new generation but is stuck at #4 YTD. The Tesla Model Y (+14%) posts another very solid month at #3 overall, a ranking it also holds YTD vs. #10 over the Full Year 2025. The Toyota Hilux (-11.7%) disappoints given its new generation but ranks #2 year-to-date. The BYD Sealion 7 (+42.4%) is the second best-selling BEV in the country at #5 overall, ahead of the Chery Tiggo 4 (+0.5%), GWM Haval Jolion (+7.3%) and Geely EX5 (+619.7%). The new Jaecoo J5 is up to #12 while the Zeekr 7X (+2971.7%) drops out of the Top 10 to a still outstanding 14th spot.
Previous month: Australia August 2026: BEVs up 169.4% to outsell petrol at record 24.9% share, Geely breaks into Top 10
One year ago: Australia September 2025: BEVs at record 11.3% share, BYD Sealion 7 and GWM Haval Jolion break into Top 10
Full September 2026 Top 60 All brands and Top 20 models below.
Australia September 2026 – brands:
| Pos | Brand | Sep-26 | % | /25 | Aug | 2026 | % | /25 | Pos | FY25 |
| 1 | Toyota | 17,682 | 16.3% | – 3.5% | 1 | 152,944 | 16.0% | – 15.9% | 1 | 1 |
| 2 | BYD | 8,191 | 7.5% | + 61.1% | 2 | 76,614 | 8.0% | + 102.0% | 2 | 8 |
| 3 | Ford | 7,592 | 7.0% | – 8.5% | 8 | 61,104 | 6.4% | – 13.8% | 3 | 2 |
| 4 | Kia | 5,901 | 5.4% | – 19.5% | 4 | 60,800 | 6.3% | – 3.3% | 4 | 4 |
| 5 | Mazda | 5,702 | 5.2% | – 18.9% | 5 | 58,865 | 6.1% | – 16.2% | 5 | 3 |
| 6 | Tesla | 5,654 | 5.2% | + 21.3% | 3 | 41,705 | 4.4% | + 84.1% | 8 | 15 |
| 7 | GWM | 5,212 | 4.8% | + 5.4% | 7 | 44,959 | 4.7% | + 14.3% | 7 | 7 |
| 8 | Hyundai | 5,073 | 4.7% | – 22.0% | 6 | 56,009 | 5.8% | – 4.2% | 6 | 5 |
| 9 | MG | 4,635 | 4.3% | + 16.7% | 9 | 36,832 | 3.8% | + 13.3% | 10 | 10 |
| 10 | Geely | 4,473 | 4.1% | + 870.3% | 10 | 23,632 | 2.5% | + 639.2% | 13 | 27 |
| 11 | Chery | 4,205 | 3.9% | + 21.8% | 11 | 38,022 | 4.0% | + 58.2% | 9 | 13 |
| 12 | Mitsubishi | 2,769 | 2.5% | – 41.5% | 13 | 33,245 | 3.5% | – 30.2% | 11 | 6 |
| 13 | Isuzu Ute | 2,696 | 2.5% | – 1.3% | 12 | 28,793 | 3.0% | – 9.5% | 12 | 9 |
| 14 | Omoda Jaecoo | 2,310 | 2.1% | + 344.2% | 14 | 15,456 | 1.6% | + 620.9% | 19 | 32 |
| 15 | BMW | 2,152 | 2.0% | – 10.8% | 20 | 17,771 | 1.9% | – 12.5% | 17 | 17 |
| 16 | Zeekr | 2,050 | 1.9% | + 1608.3% | 15 | 12,120 | 1.3% | + 1560.3% | 20 | 36 |
| 17 | Nissan | 2,028 | 1.9% | – 30.0% | 17 | 19,212 | 2.0% | – 33.3% | 15 | 12 |
| 18 | Mercedes | 2,026 | 1.9% | – 12.5% | 18 | 18,995 | 2.0% | – 8.7% | 16 | 16 |
| 19 | Subaru | 2,009 | 1.8% | – 42.6% | 16 | 21,134 | 2.2% | – 29.3% | 14 | 11 |
| 20 | Volkswagen | 1,599 | 1.5% | – 36.9% | 19 | 17,161 | 1.8% | – 23.2% | 18 | 14 |
| 21 | LDV | 1,310 | 1.2% | + 20.8% | 23 | 9,857 | 1.0% | – 8.6% | 22 | 22 |
| 22 | Honda | 1,214 | 1.1% | + 1.5% | 22 | 11,784 | 1.2% | + 1.5% | 21 | 19 |
| 23 | GAC | 1,101 | 1.0% | new | 24 | 3,175 | 0.3% | new | 31 | – |
| 24 | Suzuki | 1,049 | 1.0% | – 39.3% | 25 | 9,854 | 1.0% | – 19.3% | 23 | 20 |
| 25 | Audi | 971 | 0.9% | – 32.6% | 26 | 8,656 | 0.9% | – 21.3% | 25 | 18 |
| 26 | Lexus | 951 | 0.9% | – 6.2% | 21 | 9,466 | 1.0% | – 12.9% | 24 | 21 |
| 27 | Land Rover | 788 | 0.7% | – 5.6% | 28 | 5,660 | 0.6% | – 14.3% | 26 | 23 |
| 28 | Xpeng | 615 | 0.6% | new | 29 | 1,183 | 0.1% | new | 40 | – |
| 29 | Mini | 475 | 0.4% | – 9.5% | 31 | 4,030 | 0.4% | – 5.9% | 28 | 25 |
| 30 | Skoda | 463 | 0.4% | – 9.6% | 32 | 3,214 | 0.3% | – 5.9% | 30 | 28 |
| 31 | Volvo | 455 | 0.4% | – 39.1% | 27 | 5,166 | 0.5% | – 6.2% | 27 | 24 |
| 32 | Denza | 385 | 0.4% | new | 35 | 3,339 | 0.3% | new | 29 | 57 |
| 33 | Porsche | 364 | 0.3% | – 8.5% | 34 | 3,068 | 0.3% | – 27.4% | 33 | 26 |
| 34 | Chevrolet | 300 | 0.3% | – 16.9% | 33 | 2,671 | 0.3% | – 9.8% | 35 | 31 |
| 35 | Ram | 245 | 0.2% | – 12.5% | 37 | 2,322 | 0.2% | – 8.0% | 36 | 33 |
| 36 | Fiat | 204 | 0.2% | + 29.1% | 39 | 1,422 | 0.1% | + 1.4% | 38 | 37 |
| 37 | Polestar | 200 | 0.2% | – 15.3% | 40 | 1,679 | 0.2% | – 10.1% | 37 | 35 |
| 38 | KGM | 189 | 0.2% | – 37.0% | 30 | 2,703 | 0.3% | – 16.1% | 34 | 30 |
| 39 | Renault | 174 | 0.2% | – 42.4% | 36 | 3,133 | 0.3% | – 10.5% | 32 | 29 |
| 40 | Leapmotor | 146 | 0.1% | + 105.6% | 41 | 1,168 | 0.1% | + 158.4% | 41 | 42 |
| 41 | Foton | 139 | 0.1% | new | 38 | 1,165 | 0.1% | new | 42 | 51 |
| 42 | Cupra | 132 | 0.1% | – 12.0% | 45 | 1,417 | 0.1% | – 32.3% | 39 | 34 |
| 43 | Peugeot | 89 | 0.1% | – 25.8% | 43 | 652 | 0.1% | – 39.7% | 45 | 41 |
| 44 | Genesis | 66 | 0.1% | – 54.5% | 42 | 1,052 | 0.1% | – 10.7% | 43 | 39 |
| 45 | Deepal | 63 | 0.1% | – 33.7% | 47 | 924 | 0.1% | + 269.6% | 44 | 45 |
| 46 | JAC | 58 | 0.1% | – 47.3% | 44 | 629 | 0.1% | – 49.9% | 46 | 40 |
| 47 | Farizon | 39 | 0.0% | new | 46 | 298 | 0.0% | new | 48 | – |
| 48 | Aston Martin | 22 | 0.0% | + 0.0% | 50 | 140 | 0.0% | – 0.7% | 53 | 50 |
| 49 | Alfa Romeo | 21 | 0.0% | – 59.6% | 55 | 245 | 0.0% | – 37.7% | 50 | 44 |
| 50 | GMC | 18 | 0.0% | – 65.4% | 51 | 255 | 0.0% | + 19.2% | 49 | 46 |
| 51 | Lamborghini | 18 | 0.0% | – 28.0% | 49 | 125 | 0.0% | – 40.8% | 54 | 47 |
| 52 | Maserati | 18 | 0.0% | – 25.0% | 54 | 143 | 0.0% | – 33.8% | 51 | 48 |
| 53 | Ferrari | 16 | 0.0% | + 6.7% | 53 | 142 | 0.0% | – 9.0% | 52 | 49 |
| 54 | Jeep | 16 | 0.0% | – 85.3% | 48 | 417 | 0.0% | – 72.2% | 47 | 38 |
| 55 | Bentley | 13 | 0.0% | – 13.3% | 52 | 110 | 0.0% | + 15.8% | 55 | 52 |
| 56 | Rolls-Royce | 6 | 0.0% | + 20.0% | 57 | 41 | 0.0% | – 18.0% | 56 | 55 |
| 57 | McLaren | 1 | 0.0% | – 75.0% | 58 | 25 | 0.0% | – 51.0% | 57 | 54 |
| 58 | Citroen | 0 | 0.0% | n/a | – | 3 | 0.0% | – 62.5% | 60 | 56 |
| 59 | Forthing | 0 | 0.0% | new | – | 2 | 0.0% | new | 61 | – |
| 60 | Jaguar | 0 | 0.0% | – 100.0% | – | 7 | 0.0% | – 98.5% | 59 | 43 |
| 61 | Lotus | 0 | 0.0% | – 100.0% | 56 | 13 | 0.0% | – 75.5% | 58 | 53 |
Australia September 2026 – models:
| Pos | Model | Sep-26 | % | /25 | Aug | 2026 | % | /25 | Pos | FY25 |
| 1 | Ford Ranger | 5,062 | 4.7% | + 4.0% | 5 | 37,858 | 4.0% | – 10.0% | 1 | 1 |
| 2 | Toyota RAV4 | 4,624 | 4.3% | + 81.0% | 2 | 31,209 | 3.3% | – 11.1% | 4 | 2 |
| 3 | Tesla Model Y | 4,476 | 4.1% | + 14.0% | 1 | 35,930 | 3.8% | + 108.4% | 3 | 10 |
| 4 | Toyota Hilux | 4,455 | 4.1% | – 11.7% | 3 | 36,616 | 3.8% | – 10.3% | 2 | 3 |
| 5 | BYD Sealion 7 | 2,687 | 2.5% | + 42.4% | 6 | 19,964 | 2.1% | + 135.3% | 5 | 25 |
| 6 | Chery Tiggo 4 | 2,059 | 1.9% | + 0.5% | 7 | 19,865 | 2.1% | + 43.0% | 6 | 11 |
| 7 | GWM Haval Jolion | 2,018 | 1.9% | + 7.3% | 9 | 17,051 | 1.8% | + 20.4% | 9 | 14 |
| 8 | Geely EX5 | 2,008 | 1.8% | + 619.7% | 8 | 12,745 | 1.3% | + 322.7% | 19 | 78 |
| 9 | Toyota Prado | 2,006 | 1.8% | + 6.4% | 4 | 15,665 | 1.6% | – 28.3% | 12 | 6 |
| 10 | Isuzu D-Max | 1,866 | 1.7% | – 6.2% | 11 | 18,237 | 1.9% | – 12.0% | 8 | 4 |
| 11 | MG ZS | 1,805 | 1.7% | + 13.1% | 19 | 13,627 | 1.4% | – 14.9% | 16 | 13 |
| 12 | Jaecoo J5 | 1,754 | 1.6% | new | 13 | 11,193 | 1.2% | new | 20 | – |
| 13 | Ford Everest | 1,713 | 1.6% | – 33.0% | 14 | 16,203 | 1.7% | – 16.8% | 10 | 5 |
| 14 | Zeekr 7X | 1,628 | 1.5% | + 2971.7% | 10 | 10,800 | 1.1% | + 20277.4% | 21 | 146 |
| 15 | Hyundai Kona | 1,617 | 1.5% | – 12.3% | 12 | 18,533 | 1.9% | + 9.2% | 7 | 7 |
| 16 | Kia Sportage | 1,554 | 1.4% | + 16.3% | 15 | 14,327 | 1.5% | – 4.6% | 15 | 15 |
| 17 | BYD Shark 6 | 1,492 | 1.4% | + 25.1% | 18 | 13,586 | 1.4% | – 3.7% | 17 | 18 |
| 18 | Mazda CX-5 | 1,435 | 1.3% | – 16.8% | 17 | 15,273 | 1.6% | – 10.3% | 13 | 8 |
| 19 | Hyundai Tucson | 1,407 | 1.3% | – 11.4% | 16 | 15,679 | 1.6% | + 3.7% | 11 | 12 |
| 20 | Mitsubishi Outlander | 1,264 | 1.2% | – 29.2% | 24 | 14,584 | 1.5% | – 13.3% | 14 | 9 |
Source: VFACTS