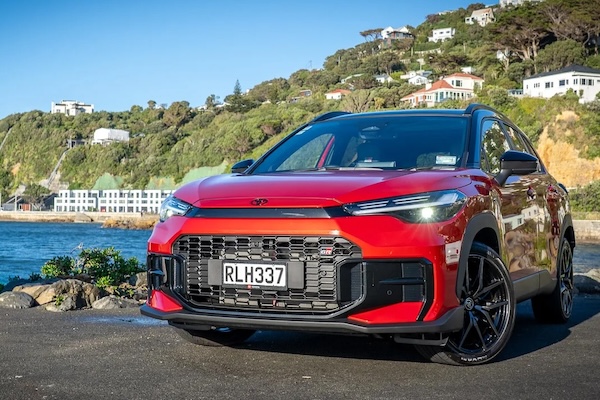
 The Toyota Corolla Cross is the best-selling vehicle in New Zealand in September.
The New Zealand new light vehicle market shoots up 22.2% year-on-year in September to 16,374 units. This is a spectacular result as September 2025 was already up 19.1% on the year prior. Passenger cars (cars and SUVs) are up 27.9% YoY to 13,244, notably pushed by rental sales, while light commercials are up 2.9% to 3,130. Year-to-date volumes are up 15.6% to 111,759.
Toyota (+11.9%) trails the market growth but still manages a strong 24.6% share vs. 21.6% so far this year. Mitsubishi (+2.5%) stays in 2nd place while Kia (+44.2%) overtakes Ford (-7%) for #3. BYD surges 482.9% YoY to land in 5th position with 6.7% share. Tesla (+185.1%) jumps to #6 vs. #10 year-to-date, and is followed by MG (+63.2%) and GWM (+49.9%). Geely surges 750% to #14.
Model-wise, we have a surprise on top: the Toyota Corolla Cross (+716.3%) spectacularly takes the lead with 6.4% share for its first ever win: its previous best was #4 achieved just last month. It is now #4 year-to-date (+209.4%). The Mitsubishi Outlander (+19%) also posts a splendid result at #2, last hit in October 2022. The Ford Ranger (+1.9%) is stuck at #3 but outsells its archenemy the Toyota Hilux (+7%). The Tesla Model Y (+209.5%) rallies back up to #7 with the Kia Sportage (+82.2%) and Stonic (+76.1%) also lodging fantastic scores.
More complete brands data will be uploaded to this article when made available to us.
Previous month: New Zealand August 2026: Hilux and RAV4 push Toyota to 28.7% share
One year ago: New Zealand September 2025: Mitsubishi (+51.6%) at highest in over three years, sales up 19.1%
Full September 2026 Top 15 brands and models below.
New Zealand September 2026 – brands:
| Pos | Brand | Sep-26 | % | /25 | Aug | 2026 | % | /25 | Pos | FY25 |
| 1 | Toyota | 4,029 | 24.6% | + 11.9% | 1 | 24,097 | 21.6% | + 3.2% | 1 | 1 |
| 2 | Mitsubishi | 2,150 | 13.1% | + 2.5% | 2 | 10,365 | 9.3% | – 0.4% | 3 | 3 |
| 3 | Kia | 1,443 | 8.8% | + 44.2% | 4 | 7,891 | 7.1% | + 12.5% | 4 | 4 |
| 4 | Ford | 1,275 | 7.8% | – 7.0% | 3 | 10,848 | 9.7% | – 2.0% | 2 | 2 |
| 5 | BYD | 1,090 | 6.7% | + 482.9% | 6 | 5,784 | 5.2% | + 99.6% | 5 | 10 |
| 6 | Tesla | 650 | 4.0% | + 185.1% | n/a | 3,026 | 2.7% | + 143.1% | 10 | 18 |
| 7 | MG | 612 | 3.7% | + 63.2% | 9 | 3,987 | 3.6% | + 27.5% | 6 | 9 |
| 8 | GWM | 553 | 3.4% | + 49.9% | 7 | 3,978 | 3.6% | + 41.4% | 7 | 11 |
| 9 | Mazda | 426 | 2.6% | – 18.5% | 5 | 3,141 | 2.8% | – 8.1% | 9 | 6 |
| 10 | Suzuki | 377 | 2.3% | – 10.0% | 8 | 3,348 | 3.0% | – 10.4% | 8 | 5 |
| 11 | Honda | 332 | 2.0% | + 31.2% | 10 | 2,561 | 2.3% | – 2.1% | 13 | 12 |
| 12 | Chery | 285 | 1.7% | + 26.7% | 11 | 2,064 | 1.8% | + 354.6% | 14 | 23 |
| 13 | Nissan | 267 | 1.6% | + 20.8% | 18 | 2,812 | 2.5% | – 28.6% | 11 | 7 |
| 14 | Geely | 238 | 1.5% | + 750.0% | n/a | n/a | n/a | n/a | n/a | 41 |
| 15 | Hyundai | 225 | 1.4% | – 46.6% | 17 | 2,605 | 2.3% | – 10.0% | 12 | 8 |
New Zealand September 2026 – models:
| Pos | Model | Sep-26 | % | /25 | Aug | 2026 | % | /25 | Pos | FY25 |
| 1 | Toyota Corolla Cross | 1,053 | 6.4% | + 716.3% | 4 | 3,357 | 3.0% | + 209.4% | 4 | 20 |
| 2 | Mitsubishi Outlander | 964 | 5.9% | + 19.0% | 6 | 3,077 | 2.8% | + 0.5% | 6 | 5 |
| 3 | Ford Ranger | 843 | 5.1% | + 1.9% | 3 | 7,071 | 6.3% | + 0.6% | 1 | 2 |
| 4 | Toyota Hilux | 823 | 5.0% | + 7.0% | 1 | 5,990 | 5.4% | – 7.5% | 2 | 3 |
| 5 | Toyota RAV4 | 803 | 4.9% | – 37.3% | 2 | 5,613 | 5.0% | – 25.2% | 3 | 1 |
| 6 | Mitsubishi ASX | 680 | 4.2% | – 15.5% | 5 | 3,141 | 2.8% | – 13.9% | 5 | 4 |
| 7 | Tesla Model Y | 588 | 3.6% | + 209.5% | n/a | 2,794 | 2.5% | n/a | 8 | 22 |
| 8 | Toyota Corolla | 450 | 2.7% | + 3.7% | 18 | n/a | n/a | n/a | n/a | 13 |
| 9 | Mitsubishi Triton | 392 | 2.4% | + 14.6% | 7 | 2,997 | 2.7% | + 17.7% | 7 | 7 |
| 10 | Kia Sportage | 317 | 1.9% | + 82.2% | 15 | 2,102 | 1.9% | n/a | 10 | 21 |
| 11 | Kia Stonic | 273 | 1.7% | + 76.1% | 11 | n/a | n/a | n/a | n/a | 24 |
| 12 | Ford Everest | 259 | 1.6% | – 28.7% | 9 | 2,130 | 1.9% | + 2.6% | 9 | 6 |
| 13 | Toyota Highlander | 251 | 1.5% | n/a | n/a | n/a | n/a | n/a | n/a | 26 |
| 14 | BYD Atto 2 | 240 | 1.5% | n/a | n/a | n/a | n/a | n/a | n/a | – |
| 15 | MG ZS | 233 | 1.4% | + 12.6% | 19 | 1,587 | 1.4% | + 3.8% | n/a | 12 |
| 16 | GWM Haval H6 | 224 | 1.4% | + 33.3% | 16 | 1,935 | 1.7% | + 49.7% | n/a | 17 |
| 17 | BYD Shark 6 | 219 | 1.3% | + 173.8% | n/a | 1,342 | 1.2% | – 10.8% | n/a | 14 |
| 18 | Kia Carnival | 211 | 1.3% | n/a | 17 | n/a | n/a | n/a | n/a | n/a |
| 19 | Toyota Hiace | 177 | 1.1% | – 24.0% | 13 | 2,060 | 1.8% | + 35.0% | n/a | 10 |
| 20 | Suzuki Swift | 174 | 1.1% | + 31.8% | 21 | n/a | n/a | n/a | n/a | 16 |
Source: MTA