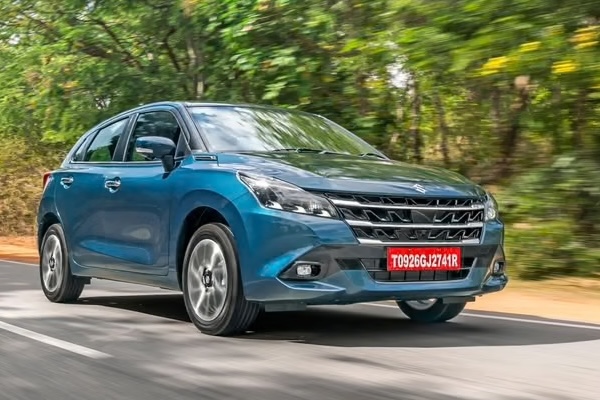
 The Maruti Suzuki Baleno is the best-selling vehicle in India in September.
The Indian wholesales market continues on its fantastic run so far this year, with September volumes up a whopping 20.9% year-on-year to 457,604 units, a new record for the month keeping in mind September 2025 was already a record at the time. The year-to-date tally is now up 22% or over 716,000 units to a new record 3,957,840 (last year was already a record also). Brand leader Maruti Suzuki (+36.9%) manages to vastly outpace the market to 39.7% share, in line with the 40% it commands year-to-date. Tata (+15.3%), Mahindra (+14%) and Hyundai (+10.9%) both trail the overall growth rate but still manage near-all time high volumes. Kia (+41%) is the best performer near the top and breaks its all time volume record at 32,017, the carmaker’s first time above 30,000 units. Nissan (+99.8%), MG (+19.2%) and Citroen (+22.6%) also shine below whereas Renault (-20.3%), Volkswagen (-20.2%), Jeep (-16%) and Honda (-15.8%) all struggle.
In the models charts, the Maruti Suzuki Baleno (+92.8%) almost doubles its sales year-on-year thanks to its facelift and snaps the pole position for the first time since last December, reaching a new highest volume of 25,392 which eclipses its previous best of 22,108 also reached last December. The Tata Nexon (-9.4%), although down YoY, rallies back up four spots on August to #2, distancing last month’s leader the Tata Punch (+28%). The Maruti Suzuki Fronx (+40.1%) and Wagon R (+22.4%) are also in excellent shape below, whereas the YTD leader, the Maruti Suzuki DZire (-11.4%) is in trouble at #6. Its YTD advantage over #2 Tata Punch is now less than 4,000 units. The Maruti Suzuki Victoris (+207.7%) celebrates one year in market at #12. Notice also the Mahindra Bolero (+253.5%), Kia Seltos (+116.5%) and Maruti Suzuki Alto (+84.5%) all scoring stellar results.
The complete models ranking will be uploaded to this article when made available to us.
Previous month: India August 2026: Tata Punch back on top in record market (+34.7%)
One year ago: India September 2025: Tata and Mahindra at all time high in record market (+5.5%)
Full September 2026 Top 14 All brands and Top 25 models below.
India September 2026 – brands:
| Pos | Brand | Sep-26 | % | /25 | Aug | 2026 | % | /25 | Pos | FY25 |
| 1 | Maruti Suzuki | 181,838 | 39.7% | + 36.9% | 1 | 1,581,988 | 40.0% | + 23.5% | 1 | 1 |
| 2 | Tata | 68,810 | 15.0% | + 15.3% | 2 | 575,583 | 14.5% | + 40.3% | 2 | 3 |
| 3 | Mahindra | 64,092 | 14.0% | + 14.0% | 3 | 541,942 | 13.7% | + 21.3% | 3 | 2 |
| 4 | Hyundai | 57,166 | 12.5% | + 10.9% | 4 | 471,724 | 11.9% | + 10.9% | 4 | 4 |
| 5 | Kia | 32,017 | 7.0% | + 41.0% | 5 | 253,008 | 6.4% | + 22.5% | 6 | 6 |
| 6 | Toyota | 25,027 | 5.5% | – 7.6% | 6 | 269,662 | 6.8% | + 9.1% | 5 | 5 |
| 7 | MG | 8,018 | 1.8% | + 19.2% | 7 | 59,646 | 1.5% | + 14.9% | 7 | 8 |
| 8 | Skoda | 6,102 | 1.3% | – 8.0% | 8 | 56,356 | 1.4% | + 5.6% | 8 | 7 |
| 9 | Honda | 4,465 | 1.0% | – 15.8% | 9 | 49,694 | 1.3% | + 12.7% | 9 | 9 |
| 10 | Renault | 3,399 | 0.7% | – 20.3% | 11 | 35,379 | 0.9% | + 36.7% | 10 | 11 |
| 11 | Nissan | 3,300 | 0.7% | + 99.8% | 10 | 29,541 | 0.7% | + 82.6% | 11 | 12 |
| 12 | Volkswagen | 2,218 | 0.5% | – 20.2% | 12 | 23,561 | 0.6% | – 14.3% | 12 | 10 |
| 13 | Citroen | 900 | 0.2% | + 22.6% | 13 | 7,580 | 0.2% | + 86.8% | 13 | 13 |
| 14 | Jeep | 252 | 0.1% | – 16.0% | 14 | 2,176 | 0.1% | – 12.0% | 14 | 14 |
India September 2026 – models:
| Pos | Model | Sep-26 | /25 | Aug | 2026 | /24 | Pos | FY25 |
| 1 | Maruti Suzuki Baleno | 25,392 | + 92.8% | 9 | 156,375 | + 30.5% | 7 | 11 |
| 2 | Tata Nexon | 20,456 | – 9.4% | 6 | 174,524 | + 27.7% | 3 | 3 |
| 3 | Tata Punch | 20,333 | + 28.0% | 1 | 182,269 | + 49.5% | 2 | 10 |
| 4 | Maruti Suzuki Fronx | 19,282 | + 40.1% | 4 | 152,926 | + 20.3% | 8 | 7 |
| 5 | Maruti Suzuki Wagon R | 18,835 | + 22.4% | 2 | 163,057 | + 11.6% | 5 | 4 |
| 6 | Maruti Suzuki DZire | 17,754 | – 11.4% | 7 | 186,167 | + 21.2% | 1 | 1 |
| 7 | Hyundai Creta | 17,657 | – 6.4% | 8 | 143,442 | – 5.8% | 9 | 2 |
| 8 | Maruti Suzuki Swift | 17,399 | + 11.9% | 3 | 156,516 | + 15.7% | 6 | 6 |
| 9 | Mahindra Scorpio | 17,313 | – 5.8% | 10 | 138,273 | + 8.4% | 10 | 8 |
| 10 | Maruti Suzuki Ertiga | 16,911 | + 39.6% | 5 | 165,328 | + 18.8% | 4 | 5 |
| 11 | Maruti Suzuki Vitara Brezza | 15,685 | + 54.2% | 11 | 131,995 | + 0.3% | 11 | 9 |
| 12 | Maruti Suzuki Victoris | 13,111 | + 207.7% | 12 | 111,335 | + 2512.9% | 12 | 34 |
| 13 | Kia Seltos | 12,593 | + 116.5% | 14 | 99,655 | + 86.6% | 15 | 25 |
| 14 | Hyundai Venue | 11,466 | – 0.2% | 15 | 102,890 | + 26.0% | 14 | 14 |
| 15 | Maruti Suzuki Eeco | 11,040 | + 10.0% | 13 | 108,321 | + 9.0% | 13 | 12 |
| 16 | Mahindra XUV 3X0 | 10,823 | + 19.8% | 22 | 79,532 | + 17.2% | 22 | 19 |
| 17 | Maruti Suzuki Alto | 10,024 | + 84.5% | 19 | 94,997 | + 52.6% | 17 | 20 |
| 18 | Mahindra Bolero | 9,710 | + 253.5% | 24 | 85,662 | + 24.9% | 19 | 17 |
| 19 | Kia Sonet | 9,493 | + 5.2% | 17 | 89,689 | + 28.7% | 18 | 18 |
| 20 | Mahindra XUV 7X0 | 9,097 | new | 20 | 81,538 | new | 21 | 80 |
| 21 | Mahindra Thar | 9,008 | – 24.0% | 16 | 97,282 | + 14.4% | 16 | 13 |
| 22 | Maruti Suzuki Grand Vitara | 8,513 | + 49.4% | 26 | 70,259 | – 4.9% | 24 | 16 |
| 23 | Hyundai Exter | 8,344 | + 47.9% | 25 | 62,455 | + 24.2% | 25 | 26 |
| 24 | Toyota Innova + Hycross | 8,008 | – 18.1% | 18 | 82,548 | + 1.1% | 20 | 15 |
| 25 | Hyundai Aura | 7,530 | + 39.8% | 27 | 57,047 | + 25.4% | 26 | 27 |
Source: Manufacturers